Chapter 4 Upper Sacramento Juveniles
This section describes environmental attributes associated with and responses during the out-migrating juvenile life stage in the Upper Sacramento River.
4.2 Environmental Drivers
4.2.1 Flow
Figure 4.1: Daily Flows (cfs) at Sacramento River at Keswick (KWK) and Sacramento River at Bend Bridge (BND) in July through September 2021 and over the 10-year average
| Year | Month | Station | Mean | Min | Max |
|---|---|---|---|---|---|
| 2021 | July | BND | 9642.1 | 9030 | 10600 |
| 2021 | August | BND | 8334.2 | 6840 | 9670 |
| 2021 | September | BND | 7072.0 | 6840 | 7300 |
| 2021 | October | BND | 13618.0 | 6220 | 36800 |
| 2021 | November | BND | 8279.9 | 4260 | 17700 |
| 2021 | December | BND | 10327.5 | 4220 | 26600 |
| 2021 | July | KWK | 9510.2 | 8740 | 10800 |
| 2021 | August | KWK | 8102.0 | 6610 | 9500 |
| 2021 | September | KWK | 6899.8 | 5310 | 8500 |
| 2021 | October | KWK | 6160.1 | 5120 | 7330 |
| 2021 | November | KWK | 4027.1 | 3070 | 5080 |
| 2021 | December | KWK | 3431.0 | 3040 | 3970 |
- Keswick: Peak flows were 10800 cfs and occurred in July. The highest mean flows were 9510.2 cfs and occurred in July.
- Bend Bridge: Peak flows were 36800 cfs and occurred in October. The highest mean flows were 13618 cfs and occurred in October.
4.2.2 Water Temperature
Figure 4.2: Daily Water Temperature (degF) at Sacramento River at Bend (BND) in 2021 and 10-year average between July and December.
| Year | Month | Station | Mean | Min | Max |
|---|---|---|---|---|---|
| 2021 | July | BND | 59.3 | 55.9 | 62.6 |
| 2021 | August | BND | 59.2 | 56.0 | 62.2 |
| 2021 | September | BND | 60.9 | 58.7 | 63.0 |
| 2021 | October | BND | 59.5 | 57.1 | 61.8 |
| 2021 | November | BND | 54.0 | 45.2 | 60.6 |
| 2021 | December | BND | 50.4 | 45.6 | 55.6 |
Summary
- In 2021 water temperature was below average for most of the season between July and December.
- Sacramento River at Bend Bridge: Maximum water temperature was 63 degrees F and occurred in September. The highest mean water temperature was 60.9 degrees F and occurred in September.
4.2.3 Dissolved Oxygen
Figure 4.3: Daily Dissolved Oxygen (mg/L) at Sacramento River at Bend Bridge (BND) in July through December 2021 and 10-year average.
| Year | Month | Station | Mean | Min | Max | Days < 6mg/L |
|---|---|---|---|---|---|---|
| 2021 | July | BND | 11.8 | 1.2 | 17.5 | 2 |
| 2021 | August | BND | 10.3 | 1.7 | 29.7 | 12 |
| 2021 | September | BND | 3.5 | 0.1 | 10.9 | 30 |
| 2021 | October | BND | 10.3 | 0.3 | 13.5 | 5 |
| 2021 | November | BND | 10.9 | 3.4 | 15.5 | 1 |
| 2021 | December | BND | 12.2 | 11.1 | 13.6 | 0 |
Summary
- Sacramento River at Bend Bridge: Minimum dissolved oxygen was 0.1 mg/L and occurred in September. The lowest mean dissolved oxygen was 3.5 mg/L and occurred in September.
4.2.4 Turbidity
Figure 4.4: Daily Turbidity at Sacramento River at Bend Bridge (BND) and Red Bluff Diversion Dam (RDB) in 2021 and 10-year average between July and December. Turbidity data have not undergone QC, other than values filtered to less than 300 NTU.
| Year | Month | Station | Mean | Min | Max |
|---|---|---|---|---|---|
| 2021 | July | BND | 76.0 | 0.5 | 2565.5 |
| 2021 | August | BND | 30.3 | 0.1 | 1310.7 |
| 2021 | September | BND | 741.1 | 0.1 | 2621.3 |
| 2021 | October | BND | 182.8 | 1.3 | 1140.2 |
| 2021 | November | BND | 46.9 | 1.0 | 1138.1 |
| 2021 | December | BND | 73.8 | 3.6 | 990.1 |
| 2021 | July | RDB | 11.6 | 9.6 | 13.5 |
| 2021 | August | RDB | 11.1 | 9.0 | 13.2 |
| 2021 | September | RDB | 8.8 | 6.0 | 11.5 |
| 2021 | October | RDB | 9.5 | 5.2 | 13.2 |
| 2021 | November | RDB | 8.6 | 6.4 | 10.9 |
| 2021 | December | RDB | 10.2 | 5.9 | 14.4 |
Summary
- Sacramento River at Bend Bridge: Minimum turbidity was 0.1 FNU and occurred in August and September. The lowest mean turbidity was 30.3 FNU and occurred in August. Turbidity was below average in parts of August and September and similar at other times of the season.
- Red Bluff Diversion Dam: Minimum turbidity was 5.2 FNU and occurred in October. The lowest mean turbidity was 8.6 FNU and occurred in November. Turbidity was below average between September and mid-December and similar at other times of the season
4.3 Biological Response
4.3.1 Fry abundance
Fry abundance (JPI) is calculated by Red Bluff USFWS by calculating the sum of: - fry passage from rotary screw trap data, and - estimated smolts and pre-smolts that pass RBDD, which are converted to fry-equivalents by applying the inverse of the fry-to-smolt survival rate (new method used as of BY2019; Voss and Poytress 2022).
4.3.1.1 Fry-equivalent JPI
Information from the RBDD Annual Report:
- Fry-to-smolt survival rate:
- Estimated Passage:
- Fry-sized juveniles:
- Pre-smolts and smolt passage:
- Percent fry passage to juvenile passage (fry/fry+smolts):
- 10-year average:
- 20-year average:
- Fry-equivalent JPI:
- Juvenile Production Index JPI in 2021 was below the average JPI between 2002 and 2021 at 0.779427.
- 10-year average:
- 20-year average:
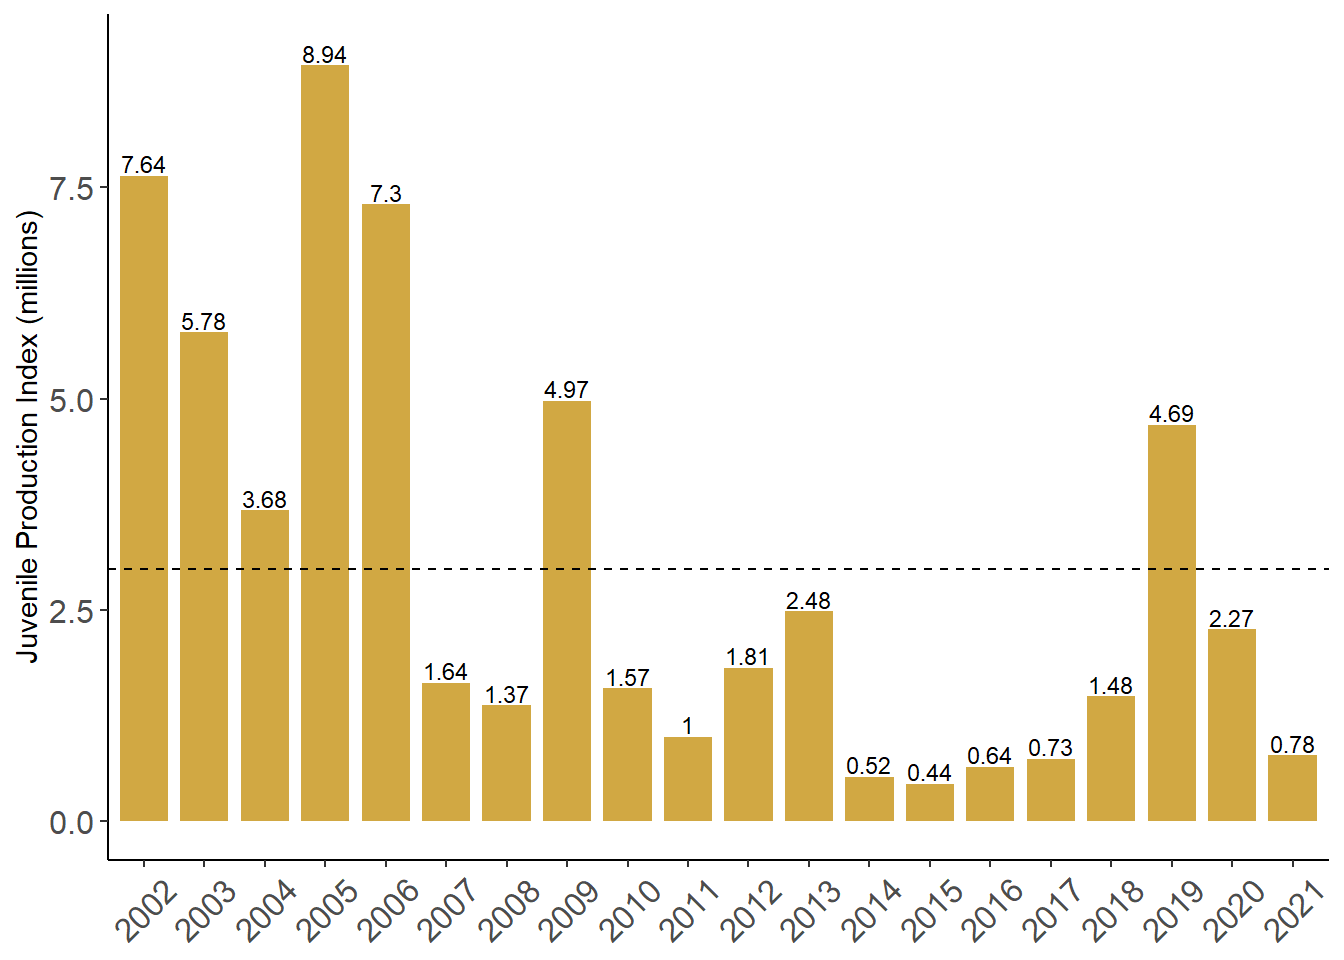
Figure 4.5: Annual JPI from 2002 to 2021
4.3.2 Telemetry Studies
Include a subset of the data
Table of telemetry release groups Reach-specific survival to below RBDD
4.3.3 Migration Timing
Passage at RBDD:
- First:
- BY2021: July 02, 2021
- 10-year median: July 06
- Middle 50% (25% to 75%):
- BY2021: September 16, 2021 to October 13, 2021
- 10-year median: September 23 to November 01
- Last:
- BY2021: May 25, 2022
- 10-year median: May 02
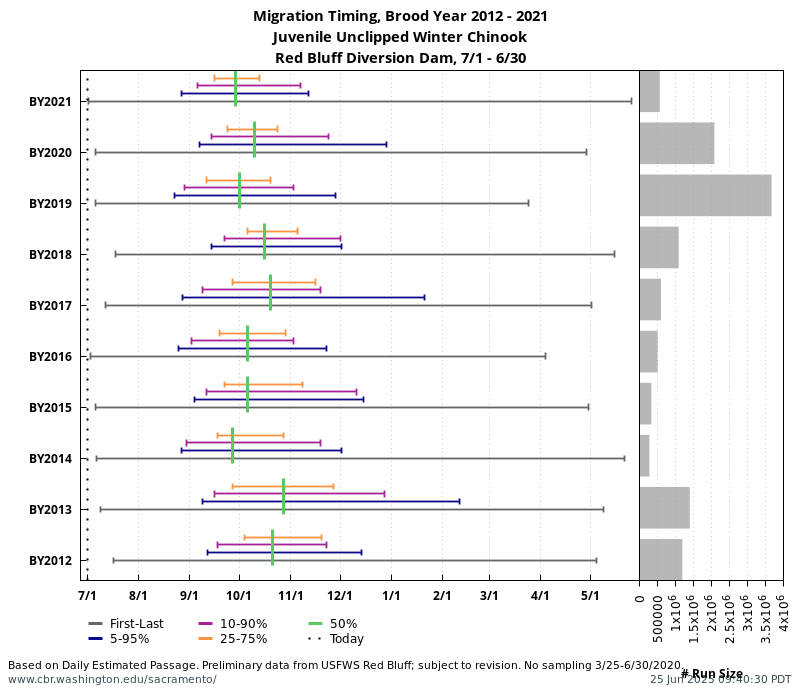
Figure 4.6: Red Bluff Diversion Dam Migration Timing
4.3.4 Stranding
A total of 383 juveniles were stranded.
| Date | Section Number | Section Name | River Miles | Count | Flow (cfs) | Flow Gage |
|---|---|---|---|---|---|---|
| 2021-08-26 | 2 | Hwy 44 Brg to A.C.I.D Dam | 298-296 | 4 | 6699 | KWK |
| 2021-11-08 | 2 | Hwy 44 Brg to A.C.I.D Dam | 298-296 | 34 | 3751 | KWK |
| 2021-11-09 | 2 | Hwy 44 Brg to A.C.I.D Dam | 298-296 | 65 | 3747 | KWK |
| 2021-11-01 | 3 | Clear Crk. Powerlines to Hwy 44 Brg | 296-288 | 12 | 4982 | KWK |
| 2021-10-28 | 4 | Balls Ferry Brg to Clear Crk Powerlines | 288-276 | 9 | 5761 | KWK |
| 2021-11-03 | 4 | Balls Ferry Brg to Clear Crk Powerlines | 288-276 | 75 | 4458 | KWK |
| 2021-11-10 | 4 | Balls Ferry Brg to Clear Crk Powerlines | 288-276 | 27 | 3582 | KWK |
| 2021-11-18 | 4 | Balls Ferry Brg to Clear Crk Powerlines | 288-276 | 11 | 3268 | KWK |
| 2021-10-27 | 8 | RBDD to Bend Brg | 257-242 | 71 | 8500 | BND |
| 2021-11-01 | 8 | RBDD to Bend Brg | 257-242 | 20 | 6268 | BND |
| 2021-11-02 | 8 | RBDD to Bend Brg | 257-242 | 46 | 6824 | BND |
| 2021-11-04 | 8 | RBDD to Bend Brg | 257-242 | 1 | 5814 | BND |
| 2021-11-16 | 8 | RBDD to Bend Brg | 257-242 | 4 | 4723 | BND |
| 2021-12-18 | 8 | RBDD to Bend Brg | 257-242 | 2 | 6198 | BND |
| 2021-12-27 | 8 | RBDD to Bend Brg | 257-242 | 2 | 8980 | BND |
4.3.5 Condition
4.3.5.1 RBDD Size
- Average daily fork length
- Early migration (July to August): 29 to 49 mm
- Middle 50% of cumulative (September 16 to October 13): 84 to 178 mm
- Late migration: 84 to 178 mm
- 74 % of fish migrated past RBDD as fry (<46 mm FL)
- Average daily fork length in 2021 was 32 to 178mm compared with the 10-year average daily fork length (29.5 to 237 mm)
Figure 4.7: Fork Length Distribution in 2021 and 10-year average at RBDD RST. The yellow line at 45 mm indicates the length transition from fry to smolt.

Figure 4.8: Fork Length Distribution over Time, RBDD RST