Chapter 3 Egg to Fry Emergence
This section describes environmental attributes associated with and responses during the egg-to-fry life stage.
3.1 Environmental Drivers
3.1.1 Storage and Flow
3.1.1.1 Shasta Storage
- See Section 2.1.1.1 for a summary of storage conditions.
3.1.1.2 Flow Conditions on the Upper Sacramento River
| Year | Station | Month | Mean | Min | Max |
|---|---|---|---|---|---|
| 2021 | KWK | May | 8369.6 | 6800 | 9870 |
| 2021 | KWK | June | 7882.3 | 6570 | 9390 |
| 2021 | KWK | July | 9510.2 | 8740 | 10800 |
| 2021 | KWK | August | 8102.0 | 6610 | 9500 |
| 2021 | KWK | September | 6899.8 | 5310 | 8500 |
| 2021 | KWK | October | 6160.1 | 5120 | 7330 |
| 2021 | KWK | November | 4027.1 | 3070 | 5080 |
| 2021 | BND | May | 8858.0 | 7170 | 10800 |
| 2021 | BND | June | 8328.5 | 7180 | 9330 |
| 2021 | BND | July | 9642.1 | 9030 | 10600 |
| 2021 | BND | August | 8334.2 | 6840 | 9670 |
| 2021 | BND | September | 7072.0 | 6840 | 7300 |
| 2021 | BND | October | 13618.0 | 6220 | 36800 |
| 2021 | BND | November | 8279.9 | 4260 | 17700 |
- Keswick: Peak flows were 1.08^{4} cfs and occurred in July. The highest mean flows were 9510.2 cfs and occurred in July.
- Bend Bridge: Peak flows were 3.68^{4} cfs and occurred in October. The highest mean flows were 1.3618^{4} cfs and occurred in October.
3.1.2 Water Temperature on the Upper Sacramento River
- See Section 2.1.2.1 for discussion around temperature threshold analysis.
3.1.3 Dissolved Oxygen Conditions on the Upper Sacramento River
| Year | Station | Month | Mean | Min | Max |
|---|---|---|---|---|---|
| 2021 | KWK | May | 8.9 | 7.4 | 10.7 |
| 2021 | KWK | June | 9.6 | 8.5 | 10.7 |
| 2021 | KWK | July | 7.2 | 2.5 | 11.0 |
| 2021 | KWK | August | 11.1 | 10.0 | 12.1 |
| 2021 | KWK | September | 12.7 | 8.6 | 15.8 |
| 2021 | KWK | October | 8.7 | 7.8 | 9.4 |
| 2021 | KWK | November | 10.0 | 8.4 | 11.6 |
| 2021 | CCR | May | 12.7 | 10.4 | 14.9 |
| 2021 | CCR | June | 12.9 | 10.6 | 15.2 |
| 2021 | CCR | July | 12.8 | 10.3 | 15.3 |
| 2021 | CCR | August | 11.6 | 10.0 | 13.1 |
| 2021 | CCR | September | 11.4 | 9.1 | 13.8 |
| 2021 | CCR | October | 10.8 | 8.7 | 12.8 |
| 2021 | CCR | November | 8.3 | 6.6 | 10.1 |
Summary
- Keswick: Minimum dissolved oxygen was 2.5 mg/L and occurred in July. The lowest mean dissolved oxygen was 7.2 mg/L and occurred in July.
- Clear Creek: Minimum dissolved oxygen was 6.6 mg/L and occurred in November. The lowest mean dissolved oxygen was 8.3 mg/L and occurred in November.
3.2 Biological Response
3.2.1 Egg to Fry Survival
Right now reading from internal spreadsheet and JPE letter SacPAS page. Final ETF survival is in USFWS RBDD spreadsheet.
Egg-to-Fry Metrics
- Total potential eggs: 31,128,320 eggs
- 10-year average: 12,855,143 eggs
- 20-year average: 16,534,741 eggs
- Fry-equivalents at RBDD (JPE Letter): 798,183.
- 10-year average: 1,430,698 including 2011, 2014-2017, 2021
- Egg to Fry Survival (ETF Survival; JPI-based): ETF Survival in 2021 was below the 10-year average ETF and below the 20-year average ETF (Figure 3.2).
- 10-year average: 18.3%
- 20-year average: 22.3%

Figure 3.2: Egg to Fry Survival
3.2.1.1 SacPAS Fish Model
The SacPAS Fish Model was developed by the University of Washington Columbia Basin Research center. The model, along with additional method and usage details, are available on: “the SacPAS website”.
The user-selected inputs to the model include:
- 2021 carcass survey, temperature, and flow data
- Stage-dependent, spatially-dependent survival (Anderson 2018) model
- Observed Keswick (KWK) flows redd dewatering option
Results
- Redds exposed to Tcritical = 11.82°C (53.28°F) are shown in Figure 3.5.
- Pre-hatching exposure: 99.9%
- Pre-emergence exposure: 100%
- Estimated total egg-to-fry emergence survival: 4.54%
- Temperature-dependent survival: 95.2%
- Temperature-dependent mortality (TDM): 4.8%
- Spawner density-based mortality: 65.6%
- Background mortality: 49.7%
- Dewater-based mortality: 1%
- Survival by reach is shown in Table 3.3
| Reach | Redd Counts | Total Survival |
|---|---|---|
| RKM483 | 1104 | 4.2% |
| RKM479 | 493 | 4.5% |
| RKM474 | 71 | 7.7% |

Figure 3.3: Potential Total Eggs in the Upper Sacramento
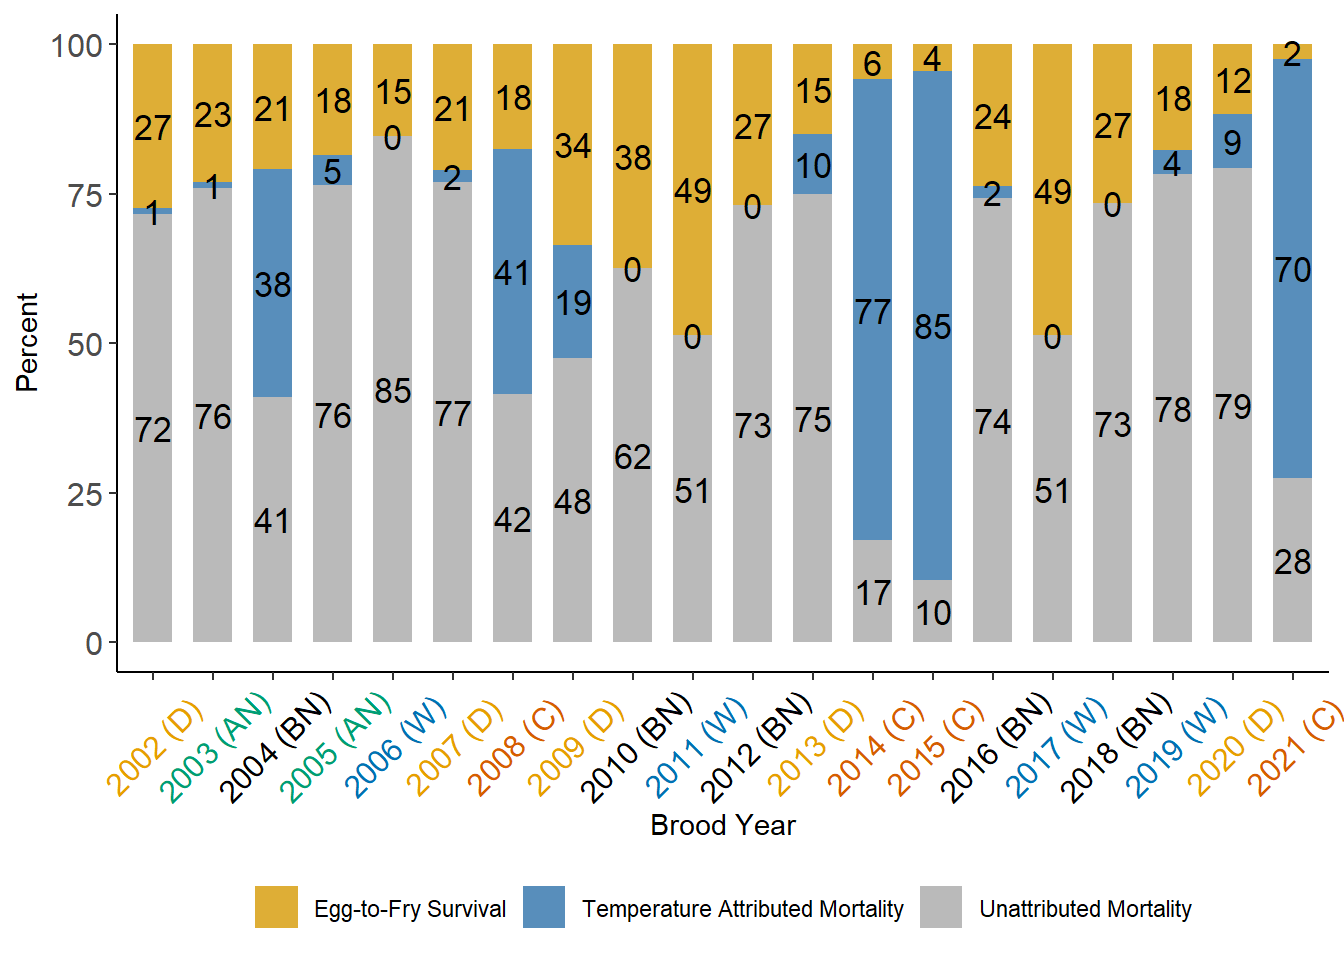
Figure 3.4: Annual Percent of Egg to Fry Survival, Temperature-Dependent Mortality, and Unattributed Survival from 2002 to 2021. Labels in parentheses indicate Water Year Type.
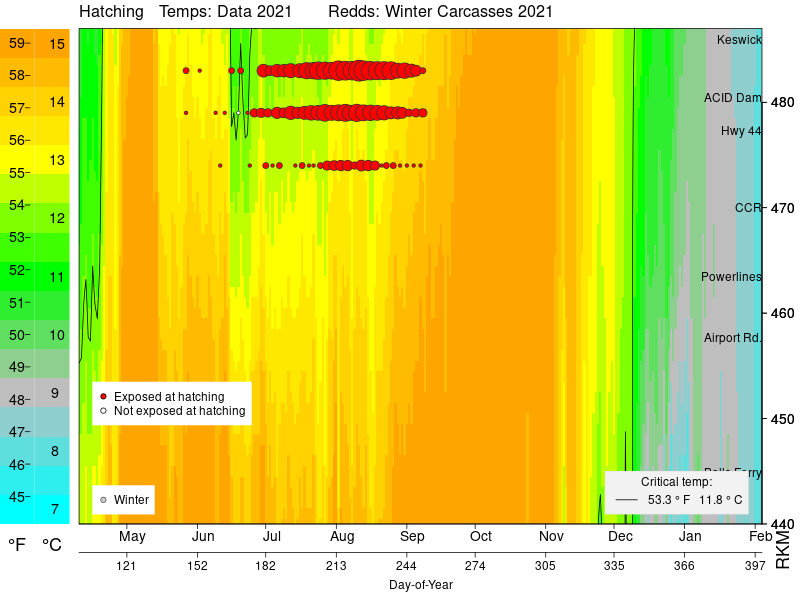
Figure 3.5: SacPAS Fish Model v3.0 Results for BY2021 Temperature Exposure for Hatching. Redds are represented by filled circles, with larger circles indicating more numerous redds. Redd data from CDFW Carcass Surveys.
3.2.2 Emergence Timing
SacPAS fish model estimates for emergence:
- First occupancy: 118
- Emergence:
- First: 192
- Mean: 255.2
- Last: 291
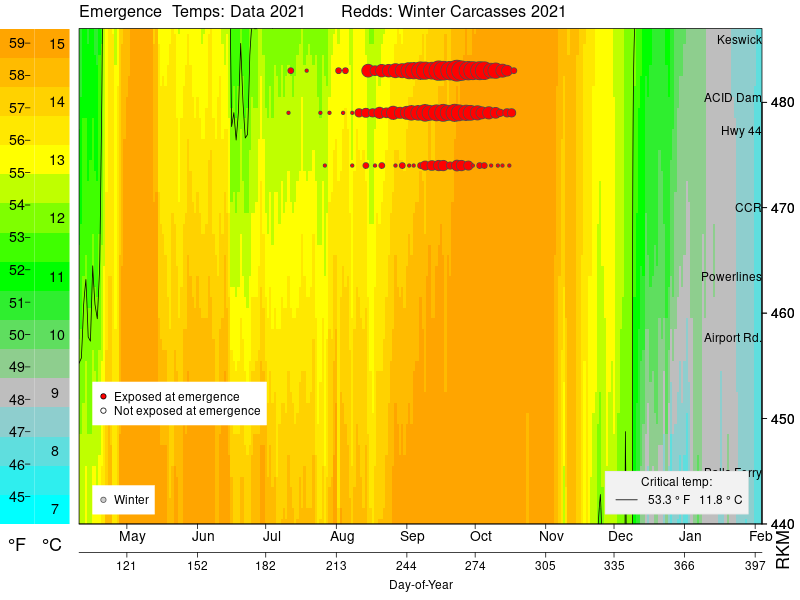
Figure 3.6: SacPAS Fish Model v3.0 Results for BY2021 Temperature Exposure for Emergence. Redds are represented by filled circles, with larger circles indicating more numerous redds. Redd data from CDFW Carcass Surveys.
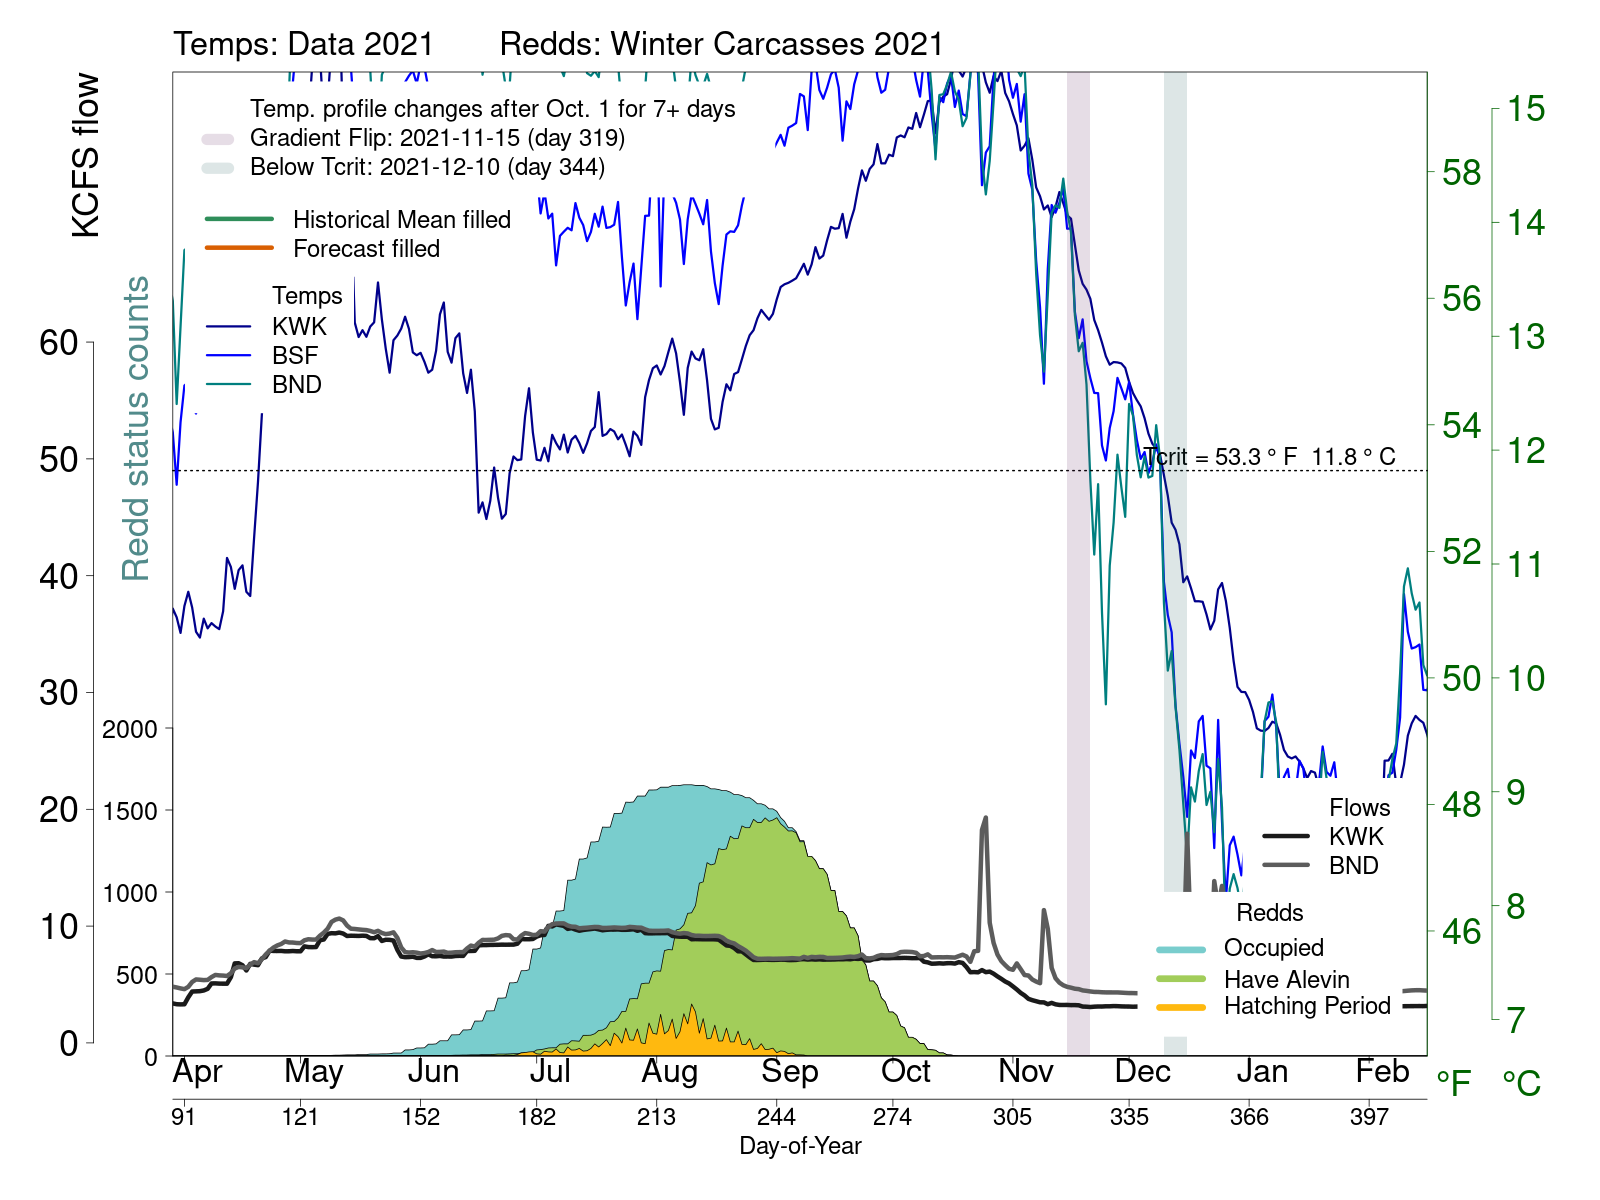
Figure 3.7: SacPAS Fish Model v3.0 Results for BY2021 Temperature Exposure for Redd Occupation and Emergence Timing. Temperature data at Sacramento River at Keswick (KWK), Sacramento River at Balls Ferry Bridge (BSF), and BND (Sacramento River at Bend Bridge) Redd data from CDFW Carcass Surveys.
3.2.3 Redd Dewatering
I don’t know if these two are the same redd (redd ID has 2 numbers switched around) What is the unit for water depth?
- 2 redds were dewatered in 2021 (Table 3.4).
| Date | River Mile | River Section | Water Depth | Flow at Keswick Dam (cfs) |
|---|---|---|---|---|
| 2021-08-25 | 297.5 | Hwy 44 Brg to A.C.I.D Dam | 0 | 7290 |
| 2021-08-25 | 297.5 | Hwy 44 Brg to A.C.I.D Dam | 0 | 7290 |