Chapter 2 Spawning Adults
This section describes environmental attributes associated with and responses during the spawning adult life stage
2.1 Environmental Drivers
2021 was a Critical water year type and 2020 was a Dry water year type.
2.1.1 Storage and Flow
2.1.1.1 Shasta Storage
Flows in the Sacramento River are dependent on Shasta storage. Adult WR Chinook Salmon rely on flows for migration cues.
Figure 2.1: Daily Shasta Dam Storage (SHA) in 2021 and over the 10-year average.
2.1.1.2 Flow Conditions on the Upper Sacramento River
Figure 2.2: Daily Flows (cfs) at Sacramento Rier at Keswick (KWK) and Sacramento River at Bend Bridge (BND) in 2021 and over the 10-year average
| Year | Month | Station | Mean | Min | Max |
|---|---|---|---|---|---|
| 2021 | January | BND | 6982.1 | 4220 | 12300 |
| 2021 | February | BND | 7358.0 | 4560 | 13500 |
| 2021 | March | BND | 7048.8 | 4540 | 10100 |
| 2021 | April | BND | 6666.7 | 4590 | 8920 |
| 2021 | May | BND | 8858.0 | 7170 | 10800 |
| 2021 | June | BND | 8328.5 | 7180 | 9330 |
| 2021 | July | BND | 9642.1 | 9030 | 10600 |
| 2021 | August | BND | 8334.2 | 6840 | 9670 |
| 2021 | September | BND | 7072.0 | 6840 | 7300 |
| 2021 | October | BND | 13618.0 | 6220 | 36800 |
| 2021 | November | BND | 8279.9 | 4260 | 17700 |
| 2021 | December | BND | 10327.5 | 4220 | 26600 |
| 2021 | January | KWK | 3217.4 | 2970 | 3700 |
| 2021 | February | KWK | 3157.9 | 2900 | 3520 |
| 2021 | March | KWK | 3405.0 | 3170 | 3640 |
| 2021 | April | KWK | 5682.5 | 3280 | 8050 |
| 2021 | May | KWK | 8369.6 | 6800 | 9870 |
| 2021 | June | KWK | 7882.3 | 6570 | 9390 |
| 2021 | July | KWK | 9510.2 | 8740 | 10800 |
| 2021 | August | KWK | 8102.0 | 6610 | 9500 |
| 2021 | September | KWK | 6899.8 | 5310 | 8500 |
| 2021 | October | KWK | 6160.1 | 5120 | 7330 |
| 2021 | November | KWK | 4027.1 | 3070 | 5080 |
| 2021 | December | KWK | 3431.0 | 3040 | 3970 |
Summary
- In 2021, storage was consistently below the 10-year average (Figure 2.1), with peak storage at 2.4 TAF in April.
- Keswick: Peak flows were 1.08^{4} cfs and occurred in July. The highest mean flows were 9510.2 cfs and occurred in July.
- Bend Bridge: Peak flows were 3.68^{4} cfs and occurred in October. The highest mean flows were 1.3618^{4} cfs and occurred in October.
2.1.2 Water Temperature
2.1.2.1 Temperature Threshold Analysis
The temperature compliance point (location of compliance to daily average temperature (DAT) of ≤56°F) varies annually based on USBR’s Temperature Management Plan.
- Conditions in 2021 indicated it was to be a Tier 4 temperature management season.
- Temperature compliance points existed on the Sacramento River at the SAC and CCR gauges and varied by month.
- See https://www.usbr.gov/mp/bdo/lto/archive/apr.html for more details.
2.1.2.2 Water Temperature at Balls Ferry Bridge and Clear Creek
Figure 2.3: Daily Average Water Temperature at Sacramento River at Clear Creek (CCR) and Sacramento River at Balls Ferry Bridge (BSF) in 2021 and over the 10-year average
| Year | Month | Station | Mean | Min | Max |
|---|---|---|---|---|---|
| 2021 | January | BSF | 48.6 | 44.2 | 52.4 |
| 2021 | February | BSF | 49.2 | 46.2 | 52.1 |
| 2021 | March | BSF | 51.7 | 47.2 | 56.2 |
| 2021 | April | BSF | 56.6 | 51.3 | 62.4 |
| 2021 | May | BSF | 59.9 | 54.8 | 65.4 |
| 2021 | June | BSF | 58.2 | 53.8 | 62.7 |
| 2021 | July | BSF | 57.6 | 54.6 | 60.7 |
| 2021 | August | BSF | 57.8 | 54.5 | 66.9 |
| 2021 | September | BSF | 59.0 | 56.2 | 61.9 |
| 2021 | October | BSF | 59.3 | 56.9 | 61.7 |
| 2021 | November | BSF | 56.4 | 52.3 | 60.5 |
| 2021 | December | BSF | 50.7 | 46.0 | 55.4 |
| 2021 | January | CCR | 50.0 | 46.5 | 53.2 |
| 2021 | February | CCR | 50.1 | 47.8 | 52.4 |
| 2021 | March | CCR | 51.6 | 47.9 | 55.4 |
| 2021 | April | CCR | 55.3 | 50.1 | 61.0 |
| 2021 | May | CCR | 59.4 | 54.7 | 64.5 |
| 2021 | June | CCR | 56.3 | 53.0 | 59.6 |
| 2021 | July | CCR | 56.0 | 53.9 | 58.1 |
| 2021 | August | CCR | 57.1 | 54.3 | 60.1 |
| 2021 | September | CCR | 58.6 | 55.9 | 61.4 |
| 2021 | October | CCR | 59.7 | 57.3 | 62.1 |
| 2021 | November | CCR | 57.0 | 53.4 | 61.0 |
| 2021 | December | CCR | 52.4 | 48.1 | 56.7 |
| 2021 | January | SAC | 49.9 | 47.7 | 52.1 |
| 2021 | February | SAC | 49.8 | 48.3 | 51.2 |
| 2021 | March | SAC | 50.9 | 48.1 | 53.6 |
| 2021 | April | SAC | 55.0 | 50.5 | 59.8 |
| 2021 | May | SAC | 58.6 | 54.8 | 62.8 |
| 2021 | June | SAC | 55.4 | 52.7 | 58.0 |
| 2021 | July | SAC | 55.0 | 53.5 | 56.6 |
| 2021 | August | SAC | 56.0 | 53.9 | 58.0 |
| 2021 | September | SAC | 57.9 | 55.6 | 60.1 |
| 2021 | October | SAC | 59.2 | 57.6 | 60.8 |
| 2021 | November | SAC | 57.1 | 54.5 | 59.9 |
| 2021 | December | SAC | 52.1 | 47.8 | 55.7 |
Summary
- Water temperatures were warmer than average and warmer than 56°F in 2021 (Figure 2.3).
- Sac R at Balls Ferry Bridge: Maximum water temperature was 66.9 degrees F and occurred in August. The highest mean water temperature was 59.9 degrees F and occurred in May.
- Sac R upstream from Confluence with Clear Creek: Maximum water temperature was 64.5 degrees F and occurred in May. The highest mean water temperature was 59.7 degrees F and occurred in October.
- Sac R upstream of Hwy 44: Maximum water temperature was 62.8 degrees F and occurred in May. The highest mean water temperature was 59.2 degrees F and occurred in October.
2.1.3 Dissolved Oxygen Conditions at Keswick Dam and Clear Creek
Figure 2.4: Daily Dissolved Oxygen (mg/L) at Sacramento River at Keswick Dam (KWK) and Sacramento River upstream from Confluence with Clear Creek (CCR).
| Year | Month | Station | Mean | Min | Max |
|---|---|---|---|---|---|
| 2021 | January | CCR | 13.0 | 11.2 | 14.8 |
| 2021 | February | CCR | 13.5 | 8.8 | 15.9 |
| 2021 | March | CCR | 13.4 | 11.5 | 15.4 |
| 2021 | April | CCR | 12.9 | 11.1 | 14.8 |
| 2021 | May | CCR | 12.7 | 10.4 | 14.9 |
| 2021 | June | CCR | 12.9 | 10.6 | 15.2 |
| 2021 | July | CCR | 12.8 | 10.3 | 15.3 |
| 2021 | August | CCR | 11.6 | 10.0 | 13.1 |
| 2021 | September | CCR | 11.4 | 9.1 | 13.8 |
| 2021 | October | CCR | 10.8 | 8.7 | 12.8 |
| 2021 | November | CCR | 8.3 | 6.6 | 10.1 |
| 2021 | December | CCR | 13.3 | 8.3 | 17.3 |
| 2021 | January | KWK | 13.1 | 12.1 | 14.0 |
| 2021 | February | KWK | 13.6 | 12.6 | 14.6 |
| 2021 | March | KWK | 13.3 | 12.3 | 14.4 |
| 2021 | April | KWK | 10.8 | 8.2 | 14.1 |
| 2021 | May | KWK | 8.9 | 7.4 | 10.7 |
| 2021 | June | KWK | 9.6 | 8.5 | 10.7 |
| 2021 | July | KWK | 7.2 | 2.5 | 11.0 |
| 2021 | August | KWK | 11.1 | 10.0 | 12.1 |
| 2021 | September | KWK | 12.7 | 8.6 | 15.8 |
| 2021 | October | KWK | 8.7 | 7.8 | 9.4 |
| 2021 | November | KWK | 10.0 | 8.4 | 11.6 |
| 2021 | December | KWK | 12.7 | 11.4 | 14.0 |
Summary
- Keswick: Minimum dissolved oxygen was 2.5 mg/L and occurred in July. The lowest mean dissolved oxygen was 7.2 mg/L and occurred in July.
- Clear Creek: Minimum dissolved oxygen was 6.6 mg/L and occurred in November. The lowest mean dissolved oxygen was 8.3 mg/L and occurred in November.
2.2 Biological Response
2.2.1 Adult Survival
In-river escapement decreased after the construction of the Red Bluff Diversion Dam (RBDD) in the 1960s.
- Sacramento River system-wide total adult escapement (currently GrandTab): 10165 90% Confidence Interval: []
- 10-year average: 4416
- 20-year average: 5612
- Total mainstem in-river spawner estimate: 9998,
- 10-year average: 4302
- 20-year average: 5555
- Mainstem natural-origin spawners (Killam): 100 %
- Mainstem hatchery-origin spawners (Killam): %
- 10-year average:
- Fish to hatchery broodstock (Killam):
- In-river mainstem transferred to Livingston Stone National Fish Hatchery (LSNFH): 298
- In-river mainstem transferred to Coleman National Fish Hatchery (CNFH): 58
- Tributary in-river spawners (Killam):
- Battle Creek:167
- Clear Creek: 0
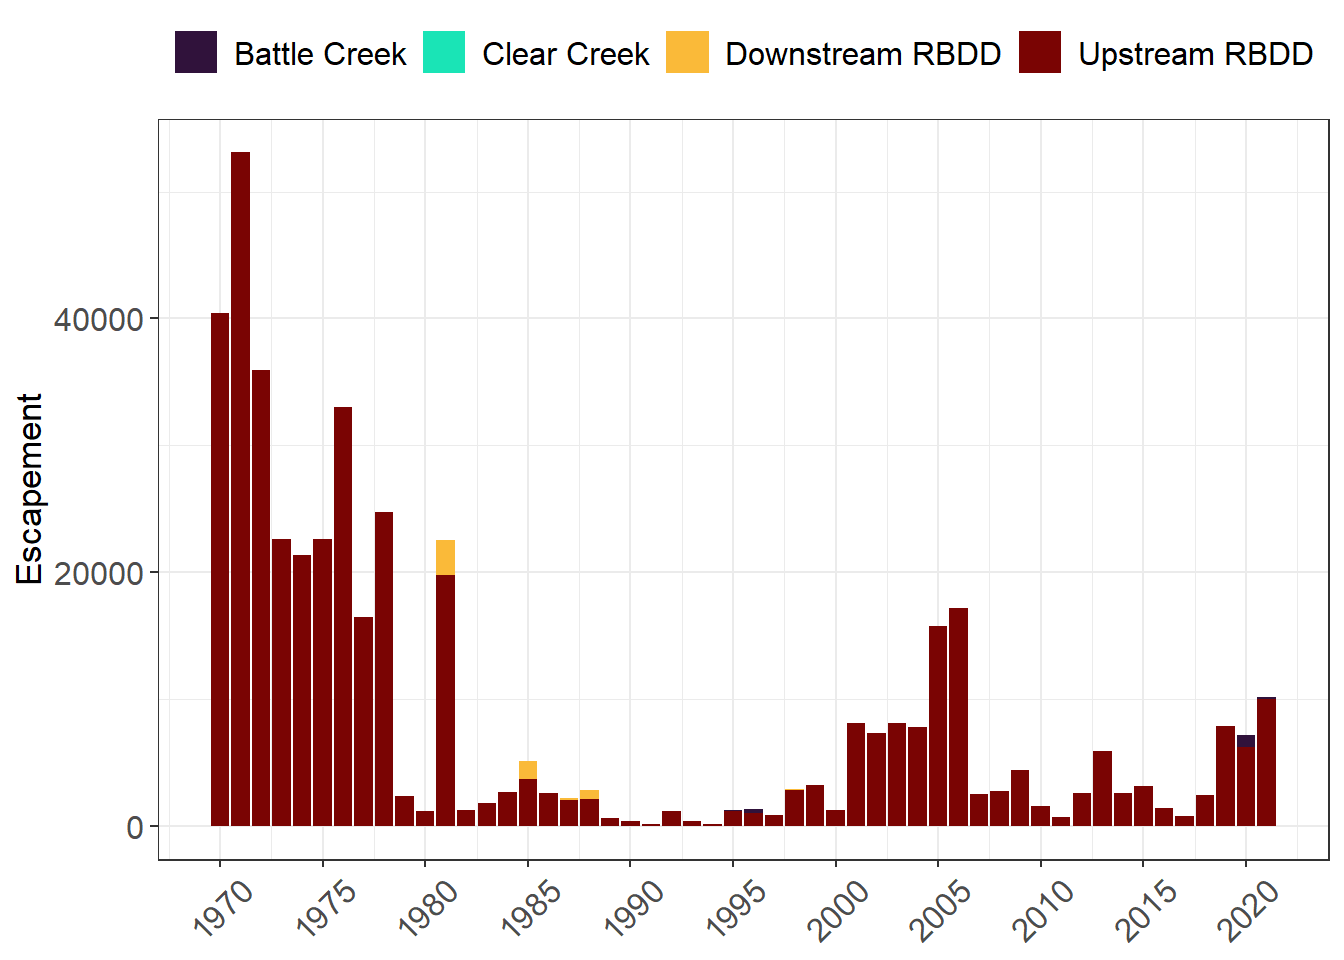
Figure 2.5: Estimated Total Mainstem In-River Spawners in 2021by reach. Data from SacPAS.
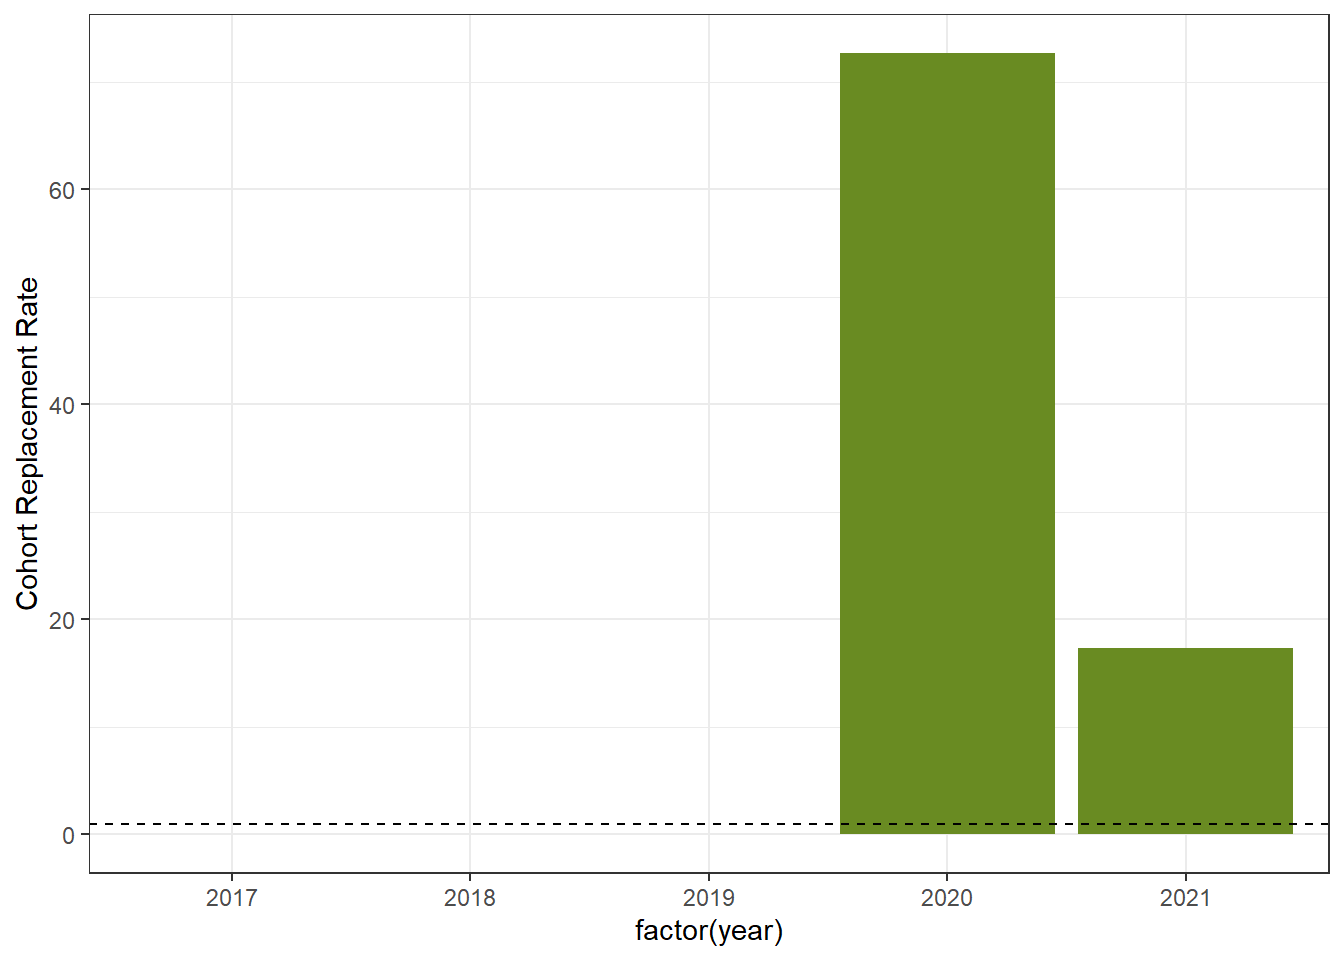
Figure 2.6: Cohort Replacement Rate. Current year female spawners are divided by number of female spawners from 3 years ago. Horizontal line is at 1.0.
| Year | Downstream RBDD | Upstream RBDD | Clear Creek | Battle Creek | Total |
|---|---|---|---|---|---|
| 2021 | 0 | 9998 | 0 | 167 | 10165 |
| 2020 | 0 | 6199 | 0 | 942 | 7141 |
| 2019 | 0 | 7853 | 0 | 21 | 7874 |
| 2018 | 0 | 2458 | 0 | 1 | 2459 |
| 2017 | 0 | 797 | 2 | 0 | 799 |
| 2016 | 0 | 1411 | 1 | 0 | 1412 |
| 2015 | 0 | 3182 | NA | 0 | 3182 |
| 2014 | 0 | 2627 | NA | 0 | 2627 |
| 2013 | 0 | 5922 | NA | 0 | 5922 |
| 2012 | 0 | 2578 | NA | 0 | 2578 |
| 2011 | 0 | 738 | NA | 1 | 739 |
| 2010 | 0 | 1533 | NA | 0 | 1533 |
| 2009 | 0 | 4416 | NA | 0 | 4416 |
| 2008 | 0 | 2725 | NA | 0 | 2725 |
| 2007 | 0 | 2487 | NA | 0 | 2487 |
| 2006 | 48 | 17149 | NA | 6 | 17203 |
| 2005 | 0 | 15730 | NA | 0 | 15730 |
| 2004 | 0 | 7784 | NA | 0 | 7784 |
| 2003 | 28 | 8105 | NA | 0 | 8133 |
| 2002 | 12 | 7325 | NA | 0 | 7337 |
| 2001 | 35 | 8085 | NA | 0 | 8120 |
| 2000 | 0 | 1261 | NA | 2 | 1263 |
| 1999 | 0 | 3264 | NA | NA | 3264 |
| 1998 | 62 | 2831 | NA | NA | 2893 |
| 1997 | 0 | 836 | NA | 44 | 880 |
| 1996 | 0 | 1012 | NA | 325 | 1337 |
| 1995 | 7 | 1159 | NA | 88 | 1254 |
| 1994 | 0 | 144 | NA | NA | 144 |
| 1993 | 9 | 369 | NA | NA | 378 |
| 1992 | 44 | 1159 | NA | NA | 1203 |
| 1991 | 0 | 177 | NA | NA | 177 |
| 1990 | 28 | 384 | NA | NA | 412 |
| 1989 | 14 | 635 | NA | NA | 649 |
| 1988 | 728 | 2129 | NA | NA | 2857 |
| 1987 | 97 | 2068 | NA | NA | 2165 |
| 1986 | NA | 2566 | NA | NA | 2566 |
| 1985 | 1445 | 3686 | NA | NA | 5131 |
| 1984 | NA | 2662 | NA | NA | 2662 |
| 1983 | NA | 1827 | NA | NA | 1827 |
| 1982 | 39 | 1233 | NA | NA | 1272 |
| 1981 | 2756 | 19795 | NA | NA | 22551 |
| 1980 | NA | 1142 | NA | NA | 1142 |
| 1979 | NA | 2339 | NA | NA | 2339 |
| 1978 | NA | 24735 | NA | NA | 24735 |
| 1977 | NA | 16470 | NA | NA | 16470 |
| 1976 | NA | 33029 | NA | NA | 33029 |
| 1975 | NA | 22579 | NA | NA | 22579 |
| 1974 | NA | 21389 | NA | NA | 21389 |
| 1973 | NA | 22651 | NA | NA | 22651 |
| 1972 | NA | 35929 | NA | NA | 35929 |
| 1971 | NA | 53089 | NA | NA | 53089 |
| 1970 | NA | 40409 | NA | NA | 40409 |
2.2.2 Fish Condition and Age Class
- Pre-spawn mortality: 4.9%
- 10-year average:
- 10-year maximum:
- 20-year average:
- 20-year maximum:
- Fecundity: 5312 eggs per female
- 10-year average: 4812 eggs per female
- 20-year average: 4998 eggs per female (only goes to 2005)
- Age classes based on size:
- Jacks and Jills = Age-2 fish
- Percent Adult Female (>=610 millimeters [mm]): 73.7%
- Percent Jills (<610 mm): 0.7%
- Percent Adult Male (>=680 mm): 23%
- Percent Jacks (<680 mm): 2.3%
| Age Class | Count | Mean FL (mm) | SD | Min FL (mm) | Max FL (mm) |
|---|---|---|---|---|---|
| Female Adult | 1606 | 748 | 45 | 610 | 911 |
| Jack | 50 | 587 | 52 | 469 | 679 |
| Jill | 15 | 568 | 50 | 412 | 604 |
| Male Adult | 501 | 854 | 62 | 680 | 1053 |
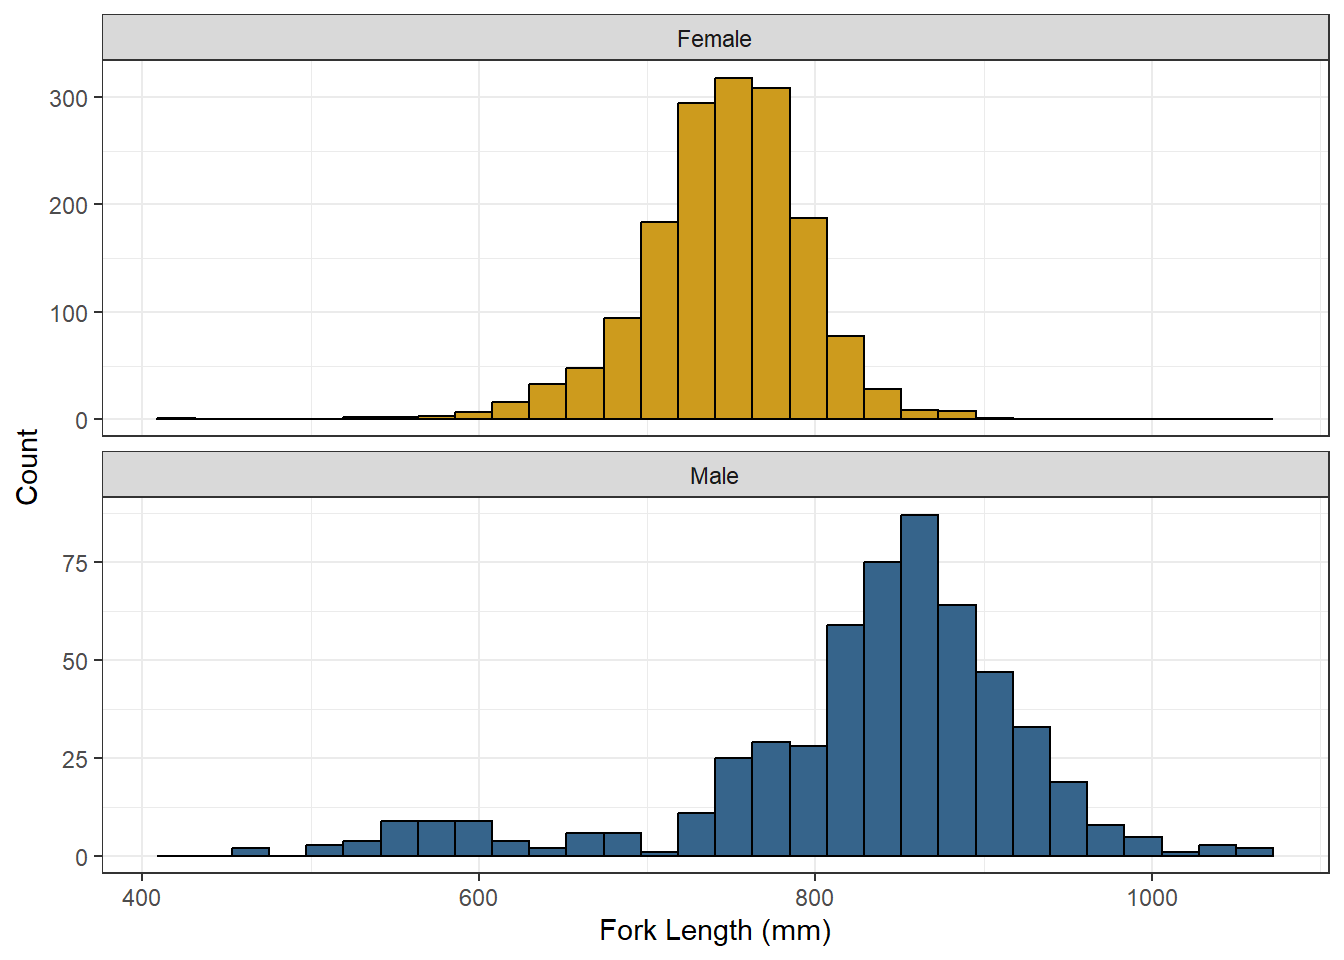
Figure 2.7: Carcass Data Fork Length Distribution. Plots are separated by Sex.
2.2.3 Migration and Spawn Timing
WRCS migration usually occurs between December through April, while spawning occurs between April and September.
2.2.3.1 Spawn Timing
- First redd observed by aerial survey:
- Spawning start week: May 02 (Week 19)
- Historical Median: Week 2017 to 2021): 20
- Historical Median: Week 2017 to 2021): 20
- Peak spawning week: July 11 (Week 29) ‒ 10-Year median: ‒ 20-Year median:

Figure 2.8: Spawn Timing, 2017 through 2021
Add 10-year and 20-year average to this plot if we have access to the data.
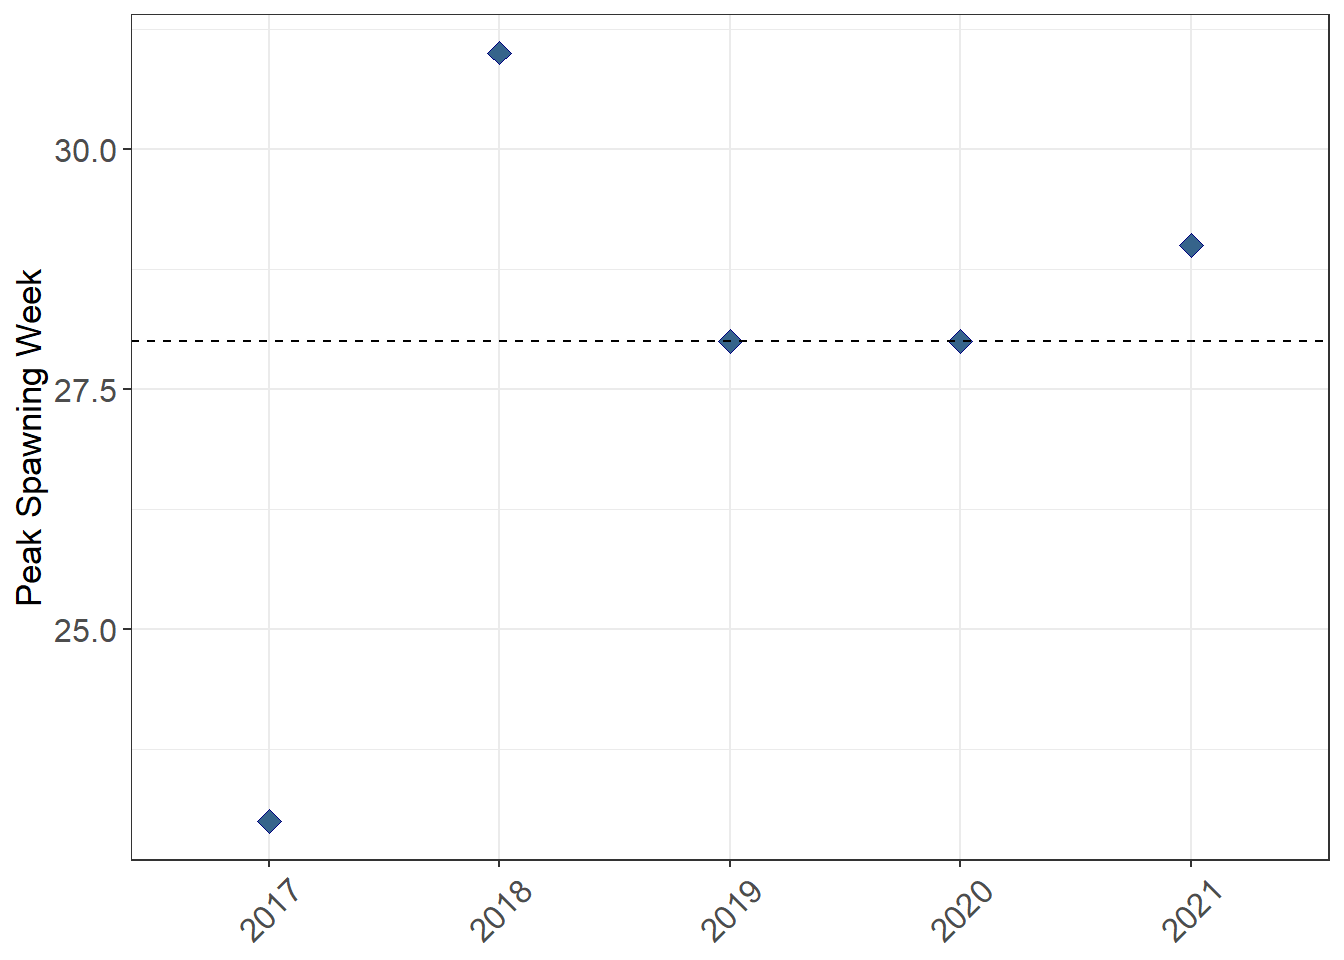
Figure 2.9: Peak Spawning Week from 2000 to 2021
Expand data to include more years (should have 10-year median and 20-year median)
2.2.4 Carcass and Redd Abundance and Distribution
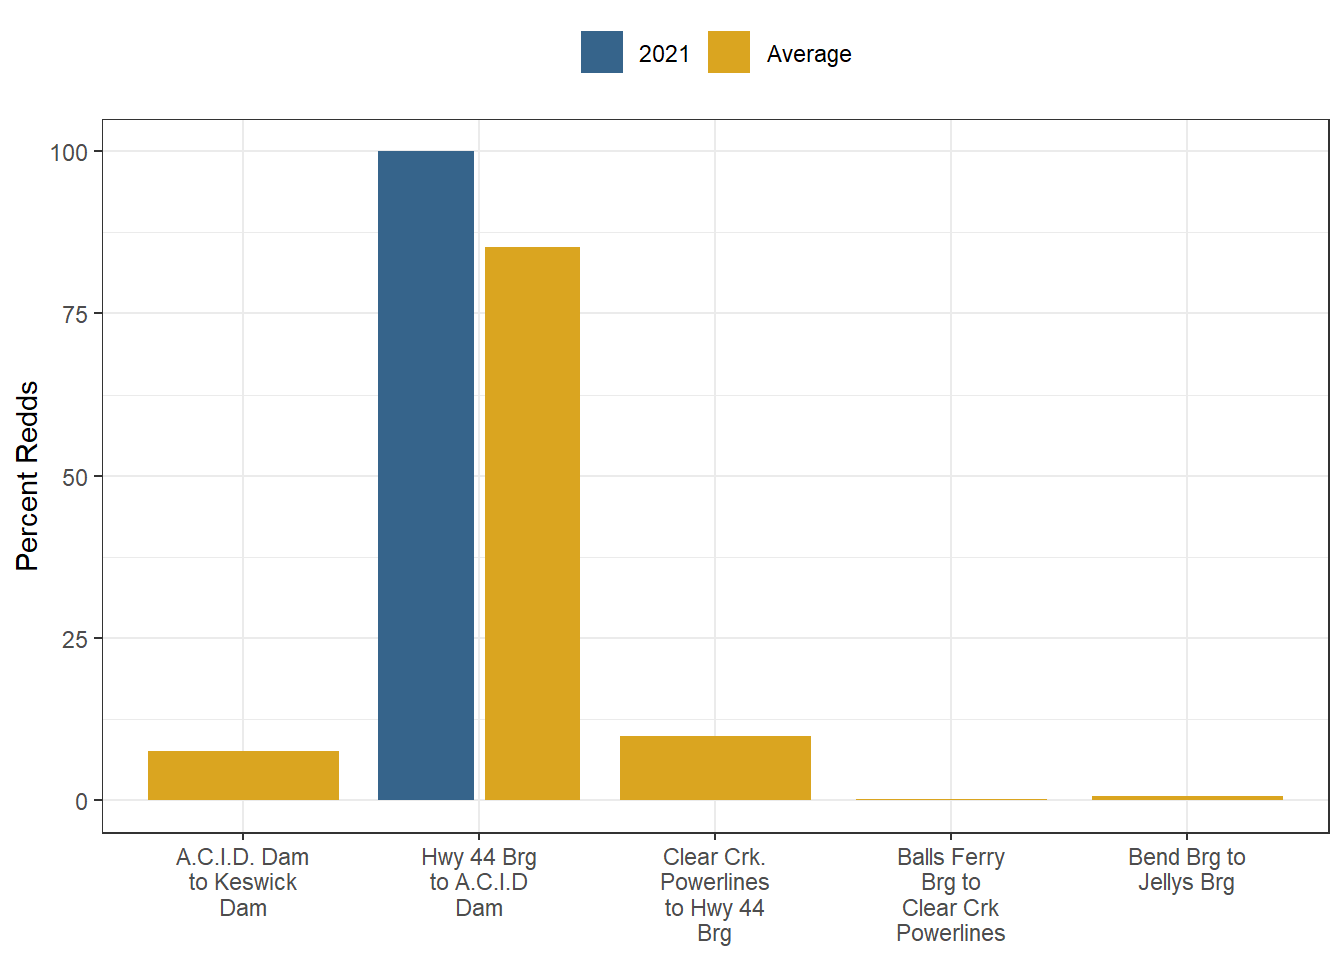
2.2.4.1 Redd Abundance
| Section | Section Name | Count | Percent | Average |
|---|---|---|---|---|
| 1 | A.C.I.D. Dam to Keswick Dam | NA | NA | 8.00% |
| 2 | Hwy 44 Brg to A.C.I.D Dam | 484 | 100.00% | 85.00% |
| 3 | Clear Crk. Powerlines to Hwy 44 Brg | NA | NA | 10.00% |
| 4 | Balls Ferry Brg to Clear Crk Powerlines | NA | NA | 0.00% |
| 7 | Bend Brg to Jellys Brg | NA | NA | 1.00% |
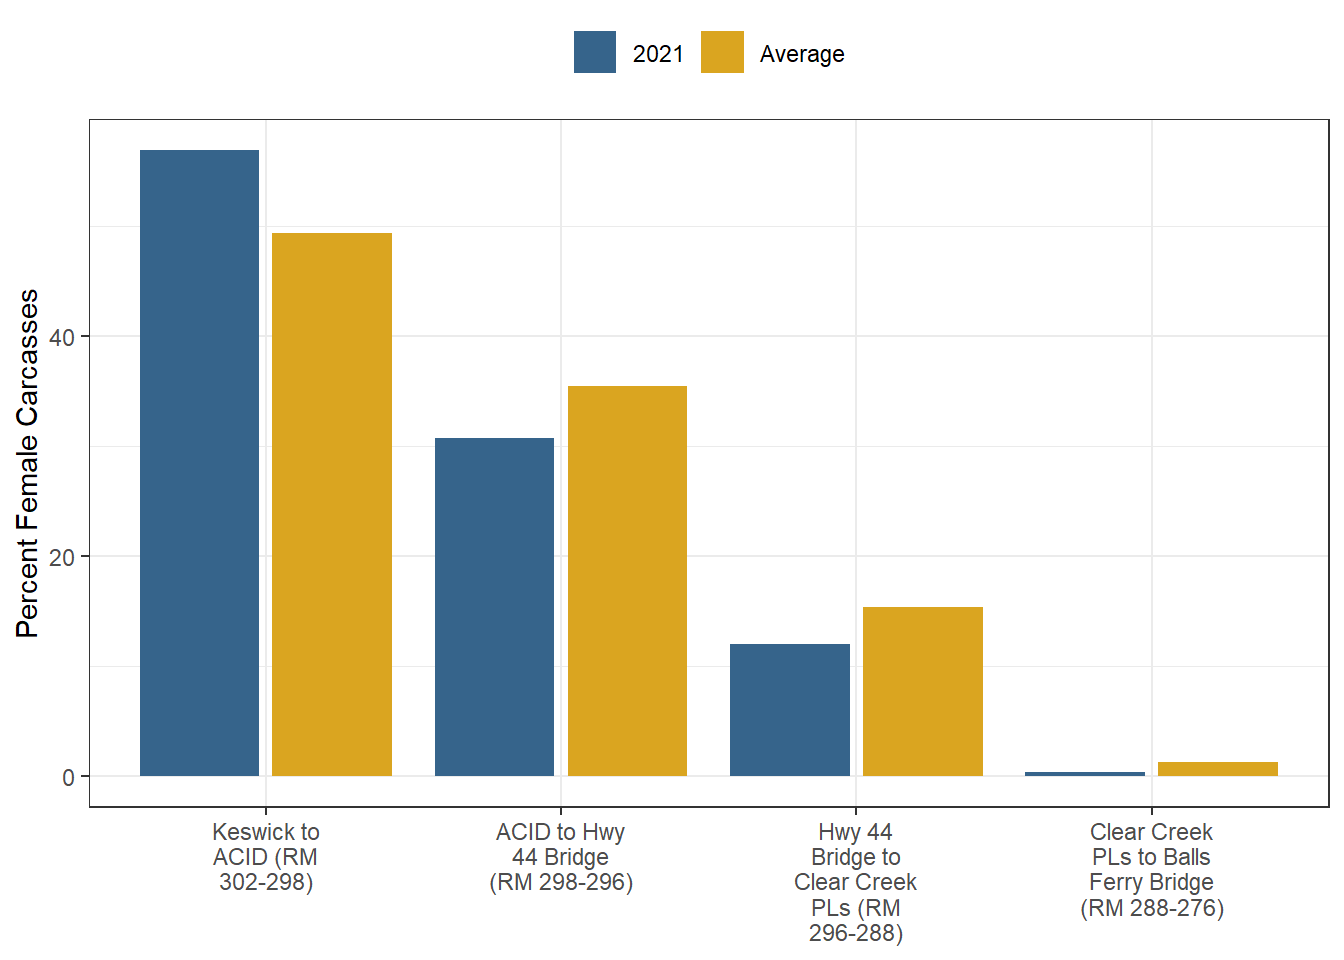
2.2.4.2 Carcass Abundance
| Section Name | Section | Count | Percent | Average |
|---|---|---|---|---|
| Keswick to ACID (RM 302-298) | 1 | 202 | 36.0% | 22.0% |
| ACID to Hwy 44 Bridge (RM 298-296) | 2 | 132 | 24.0% | 25.0% |
| Hwy 44 Bridge to Clear Creek PLs (RM 296-288) | 3 | 163 | 29.0% | 40.0% |
| Clear Creek PLs to Balls Ferry Bridge (RM 288-276) | 4 | 58 | 10.0% | 23.0% |
Figure 2.10: Redd Counts by Year. Dashed line indicates average from 2013 to 2021
It would be nice to include here a map of each reach