Chapter 5 Middle and Lower Sacramento Juveniles
This section describes environmental attributes associated with and responses during the out-migrating juvenile life stage in the Lower and Middle Sacramento River.
5.1 Habitat Attributes
Habitat Capacity (Floodplain Connectivity)
Habitat Capacity: Depth/Shallow Water
In-Stream Habitat Capacity
5.1.1 Storage and Flows
Shasta Storage/Hydrology
Flows: Migration Cues
5.1.1.1 Flow Conditions on the Middle and Lower Sacramento River
Figure 5.1: Daily Flows (cfs) at Sacramento River at Hamilton City (HMC), Sacramento River at Wilkins Slough (WLK) and Sacramento River at Verona (VON) from September 2021 through March 2022 and over the 10-year average
| Year | Month | Station | Mean | Min | Max |
|---|---|---|---|---|---|
| 2021 | September | HMC | 5885.7 | 5590 | 6182 |
| 2021 | October | HMC | 13842.8 | 5945 | 47509 |
| 2021 | November | HMC | 7181.8 | 3983 | 17544 |
| 2021 | December | HMC | 11421.0 | 3400 | 29442 |
| 2022 | January | HMC | 7669.2 | 4678 | 12005 |
| 2022 | February | HMC | 4326.8 | 3744 | 4934 |
| 2022 | March | HMC | 3983.1 | 3615 | 4333 |
| 2021 | September | WLK | 5605.0 | 5290 | 5920 |
| 2021 | October | WLK | 11000.4 | 5650 | 25100 |
| 2021 | November | WLK | 7160.0 | 4370 | 12700 |
| 2021 | December | WLK | 9375.3 | 3990 | 20600 |
| 2022 | January | WLK | 7715.4 | 5190 | 12000 |
| 2022 | February | WLK | 4732.0 | 4060 | 5400 |
| 2022 | March | WLK | 4200.0 | 3930 | 4470 |
| 2021 | September | VON | 7827.2 | 7160 | 8420 |
| 2021 | October | VON | 18089.0 | 7110 | 35500 |
| 2021 | November | VON | 8051.0 | 5480 | 12900 |
| 2021 | December | VON | 15431.8 | 5500 | 31900 |
| 2022 | January | VON | 14467.4 | 9010 | 23200 |
| 2022 | February | VON | 10197.1 | 9610 | 11500 |
| 2022 | March | VON | 8856.6 | 7490 | 11200 |
5.1.1.2 Juvenile WRCS Rescued During Stranding Surveys
Fish were not stranded in the Middle to Lower Sacramento River for Brood Year 2021.
Summary
Hamilton City: Peak flows were 47509 cfs and occurred in October. The highest mean flows were 13842.8 cfs and occurred in October.
Wilkins Slough: Peak flows were 25100 cfs and occurred in October. The highest mean flows were 11000.4 cfs and occurred in October.
Verona: Peak flows were 35500 cfs and occurred in October. The highest mean flows were 18089 cfs and occurred in October.
5.1.2 Environmental Drivers
5.1.2.1 Turbidity
Figure 5.2: Daily Turbidity at Red Bluff Diversion Dam (RDB) and Sacramento River at Freeport (FPT) from September 2021 through March 2022
| Year | Month | Station | Mean | Min | Max |
|---|---|---|---|---|---|
| 2021 | September | RDB | 8.8 | 6.0 | 11.5 |
| 2021 | October | RDB | 9.5 | 5.2 | 13.2 |
| 2021 | November | RDB | 8.6 | 6.4 | 10.9 |
| 2021 | December | RDB | 10.3 | 5.9 | 14.5 |
| 2022 | January | RDB | 14.0 | 11.1 | 16.9 |
| 2022 | February | RDB | 14.4 | 11.4 | 17.3 |
| 2022 | March | RDB | 9.7 | 4.3 | 15.3 |
| 2021 | September | FPT | 2.6 | 0.8 | 5.2 |
| 2021 | October | FPT | 47.7 | 1.0 | 123.0 |
| 2021 | November | FPT | 10.1 | 3.4 | 24.0 |
| 2021 | December | FPT | 44.2 | 2.3 | 107.0 |
| 2022 | January | FPT | 14.5 | 1.6 | 30.3 |
| 2022 | February | FPT | 7.3 | 3.0 | 11.8 |
| 2022 | March | FPT | 5.1 | 1.8 | 10.1 |
Summary
- Red Bluff Diversion Dam: Minimum turbidity was 4.3 FNU and occurred in March. The lowest mean turbidity was 8.6 FNU and occurred in November.
- Sacramento River at Freeport: Minimum turbidity was 0.8 FNU and occurred in September. The lowest mean turbidity was 2.6 FNU and occurred in September.
5.1.2.2 Water Temperature
| Year | Month | Station | Mean | Min | Max | Water Temp < 63 Degf |
|---|---|---|---|---|---|---|
| 2021 | September | WLK | 69.5 | 63.8 | 90.7 | 30 |
| 2021 | October | WLK | 61.2 | 57.3 | 71.7 | 8 |
| 2021 | November | WLK | 56.8 | 52.4 | 62.0 | 0 |
| 2021 | December | WLK | 49.7 | 45.1 | 54.9 | 0 |
| 2022 | January | WLK | 48.7 | 44.8 | 51.0 | 0 |
| 2022 | February | WLK | 51.9 | 47.0 | 56.7 | 0 |
| 2022 | March | WLK | 58.8 | 53.0 | 66.7 | 8 |
Summary
- Maximum water temperature was 90.7 degrees F and occurred in September. The highest mean water temperature was 69.5 degrees F and occurred in September.
- The month with greatest days exceeding 63 degrees F (30 days) was September.
5.1.2.3 Dissolved Oxygen
| Year | Month | Station | Mean | Min | Max | Do < 6mg/L |
|---|---|---|---|---|---|---|
| 2021 | September | RDB | 8.4 | 6.0 | 11.5 | 0 |
| 2021 | October | RDB | 9.9 | 5.2 | 13.2 | 5 |
| 2021 | November | RDB | 8.5 | 6.4 | 10.9 | 0 |
| 2021 | December | RDB | 10.2 | 5.9 | 14.5 | 1 |
| 2022 | January | RDB | 14.2 | 11.1 | 16.9 | 0 |
| 2022 | February | RDB | 14.5 | 11.4 | 17.3 | 0 |
| 2022 | March | RDB | 8.3 | 4.3 | 15.3 | 17 |
| 2021 | September | SRH | 8.2 | 7.6 | 9.2 | 0 |
| 2021 | October | SRH | 8.8 | 6.4 | 10.0 | 0 |
| 2021 | November | SRH | 8.9 | 7.1 | 10.1 | 0 |
| 2021 | December | SRH | 10.1 | 9.5 | 10.7 | 0 |
| 2022 | January | SRH | 11.0 | 10.6 | 11.4 | 0 |
| 2022 | February | SRH | 10.9 | 10.2 | 11.7 | 0 |
| 2022 | March | SRH | 9.9 | 8.5 | 11.1 | 0 |
Summary
- Sacramento River at Bend Bridge: Minimum dissolved oxygen was 4.3 mg/L and occurred in March. The lowest mean dissolved oxygen was 8.3 mg/L and occurred in March.
- Sacramento River at Hood: Minimum dissolved oxygen was 6.4 mg/L and occurred in October. The lowest mean dissolved oxygen was 8.2 mg/L and occurred in September.
5.2 Biological Response
Monitoring Sources for abundance, growth/size, migration timing/duration
- Sac Trawl
- Tisdale Weir
- Knights Landing
- GCID
- DJFMP
- Yolo Bypass
- Chipps Island Trawl (Exit)
- Genetic (Chipps, SWP/CVP, Knights Landing, Yolo Bypass)
Data Sources
- JPE, Smolt survival from JPE Letters (link)
5.2.1 Juvenile Production Estimate (Abundance)

Figure 5.3: Total Natural production entering the Delta (JPE)

Figure 5.4: Total Hatchery Production entering the Delta (Hatchery JPE)
5.2.2 Smolt Survival
5.2.2.1 JPE Letter
Natural-origin smolt survival is calculated at the Tower Bridge from acoustically tagged hatchery fish that are released at RBDD.
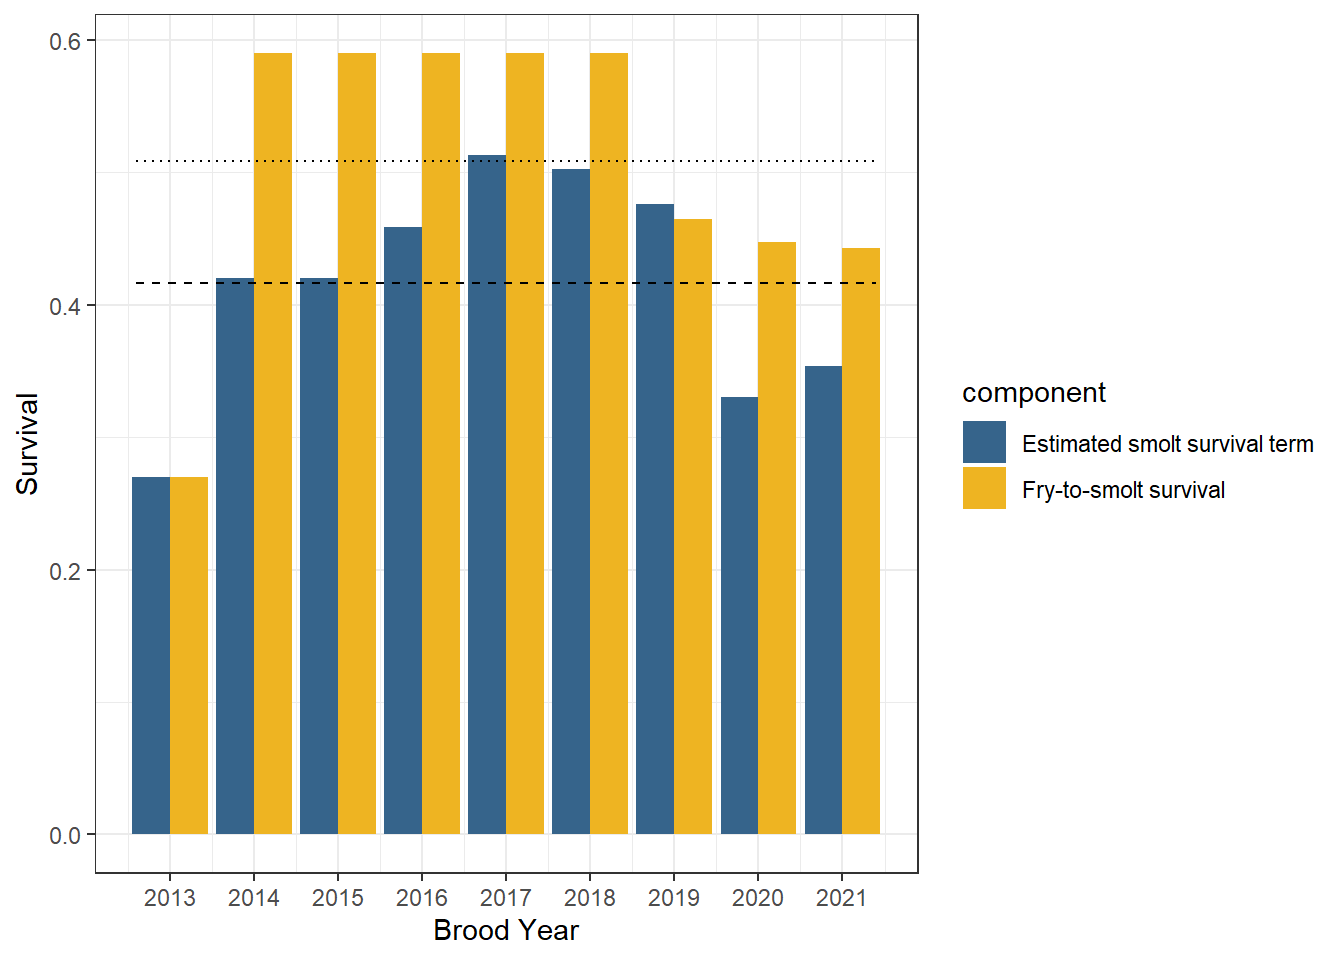
Figure 5.5: Natural-origin Smolt Survival from RBDD to Tower Bridge. A new calculation method was implemented for BY 2019, resulting in lower estimates. Prior to 2013 a constant value of 0.54 was used.
5.2.2.2 Acoustic Tagging
Reach-specific survival
| rel_date | reach_start | reach_end | rkm_start | ReachSurvival | CumulativeSurvival | count |
|---|---|---|---|---|---|---|
| 2022-02-10 | Caldwell_Park_Rel | Blw_Cypress | 551 | 0.995 (0.988, 0.998) | 1 (0, 0) | 139 |
| 2022-02-10 | Blw_Cypress | Blw_ClearCr | 544 | 0.999 (0.994, 1) | 0.964 (0.92, 0.98) | 134 |
| 2022-02-10 | Blw_ClearCr | BlwCowCr | 536 | 0.999 (0.996, 1) | 0.957 (0.91, 0.98) | 133 |
| 2022-02-10 | BlwCowCr | Battle_Conf | 521 | 0.999 (0.995, 1) | 0.95 (0.9, 0.98) | 132 |
| 2022-02-10 | Battle_Conf | Blw_Paynes_Ck | 507 | 0.997 (0.995, 0.999) | 0.935 (0.88, 0.97) | 130 |
| 2022-02-10 | Blw_Paynes_Ck | Blw_Salt | 476 | 0.996 (0.992, 0.998) | 0.863 (0.8, 0.91) | 120 |
| 2022-02-10 | Blw_Salt | Mill_Ck_Conf | 457 | 0.999 (0.99, 1) | 0.799 (0.72, 0.86) | 111 |
| 2022-02-10 | Mill_Ck_Conf | Ord | 441 | 0.992 (0.989, 0.994) | 0.782 (0.7, 0.85) | 106 |
| 2022-02-10 | Ord | Colusa AC2 | 372 | 0.989 (0.984, 0.993) | 0.449 (0.36, 0.54) | 57 |
| 2022-02-10 | Colusa AC2 | AbvColusaBr | 319 | 0.998 (0.978, 1) | 0.252 (0.19, 0.33) | 35 |
| 2022-02-10 | AbvColusaBr | Colusa BC2 | 308 | 0.998 (0.947, 1) | 0.245 (0.18, 0.32) | 31 |
| 2022-02-10 | Colusa BC2 | AbvTisdale | 296 | 0.997 (0.988, 0.999) | 0.241 (0.18, 0.32) | 26 |
| 2022-02-10 | AbvTisdale | Knights_RST | 269 | 0.995 (0.99, 0.998) | 0.224 (0.16, 0.3) | 30 |
| 2022-02-10 | Knights_RST | Abv_FremontWeir | 222 | 0.995 (0.952, 0.999) | 0.18 (0.12, 0.25) | 25 |
| 2022-02-10 | Abv_FremontWeir | SacFeather | 215 | 0.995 (0.965, 0.999) | 0.174 (0.12, 0.25) | 21 |
| 2022-02-10 | SacFeather | Blw_Elkhorn_GS1 | 206 | 1 (1, 1) | 0.165 (0.11, 0.24) | 22 |
| 2022-02-10 | Blw_Elkhorn_GS1 | TowerBridge | 192 | 0.998 (0.984, 1) | 0.165 (0.11, 0.24) | 23 |
| 2022-02-10 | TowerBridge | SacTrawl | 172 | 1 (1, 1) | 0.158 (0.11, 0.23) | 22 |
| 2022-02-10 | NA | NA | 167 | NA (NA, NA) | 0.158 (0.11, 0.23) | 22 |
| 2022-02-10 | Freeport | Abv_Clarksburg | 152 | 1 (1, 1) | 0.137 (0.09, 0.2) | 19 |
| 2022-02-10 | Abv_Clarksburg | Hood | 148 | 1 (1, 1) | 0.137 (0.09, 0.2) | 19 |
| 2022-02-10 | Hood | Chipps | 138 | 0.992 (0.984, 0.996) | 0.137 (0.09, 0.2) | 19 |
| 2022-02-10 | Chipps | Benicia | 71 | 0.989 (0.959, 0.997) | 0.08 (0.04, 0.14) | 11 |
| 2022-02-10 | Benicia | GoldenGateE | 52 | 1 (1, 1) | 0.065 (0.03, 0.12) | 9 |
| 2022-02-10 | NA | NA | 2 | NA (NA, NA) | 0.065 (0.03, 0.12) | 2 |
| 2022-03-02 | Caldwell_Park_Rel | Blw_Cypress | 551 | 0.996 (0.993, 0.998) | 1 (0, 0) | 430 |
| 2022-03-02 | Blw_Cypress | Blw_ClearCr | 544 | 0.999 (0.997, 1) | 0.972 (0.95, 0.98) | 418 |
| 2022-03-02 | Blw_ClearCr | BlwCowCr | 536 | 1 (0.999, 1) | 0.963 (0.94, 0.98) | 414 |
| 2022-03-02 | BlwCowCr | Battle_Conf | 521 | 0.998 (0.997, 0.999) | 0.958 (0.94, 0.97) | 412 |
| 2022-03-02 | Battle_Conf | Blw_Paynes_Ck | 507 | 0.997 (0.996, 0.998) | 0.935 (0.91, 0.96) | 402 |
| 2022-03-02 | Blw_Paynes_Ck | Blw_Salt | 476 | 0.997 (0.995, 0.998) | 0.856 (0.82, 0.89) | 368 |
| 2022-03-02 | Blw_Salt | Mill_Ck_Conf | 457 | 0.993 (0.99, 0.996) | 0.8 (0.76, 0.84) | 344 |
| 2022-03-02 | Mill_Ck_Conf | Ord | 441 | 0.988 (0.986, 0.99) | 0.722 (0.67, 0.77) | 291 |
| 2022-03-02 | Ord | Colusa AC2 | 372 | 0.991 (0.988, 0.994) | 0.315 (0.27, 0.36) | 116 |
| 2022-03-02 | Colusa AC2 | AbvColusaBr | 319 | 0.99 (0.981, 0.995) | 0.198 (0.16, 0.24) | 85 |
| 2022-03-02 | AbvColusaBr | Colusa BC2 | 308 | 0.997 (0.987, 0.999) | 0.178 (0.14, 0.22) | 68 |
| 2022-03-02 | Colusa BC2 | AbvTisdale | 296 | 0.999 (0.995, 1) | 0.171 (0.14, 0.21) | 61 |
| 2022-03-02 | AbvTisdale | Knights_RST | 269 | 0.998 (0.996, 0.999) | 0.166 (0.13, 0.2) | 69 |
| 2022-03-02 | Knights_RST | Abv_FremontWeir | 222 | 0.998 (0.981, 1) | 0.153 (0.12, 0.19) | 66 |
| 2022-03-02 | Abv_FremontWeir | SacFeather | 215 | 0.998 (0.985, 1) | 0.151 (0.12, 0.19) | 58 |
| 2022-03-02 | SacFeather | Blw_Elkhorn_GS1 | 206 | 0.996 (0.989, 0.999) | 0.149 (0.12, 0.19) | 61 |
| 2022-03-02 | Blw_Elkhorn_GS1 | TowerBridge | 192 | 0.994 (0.987, 0.997) | 0.142 (0.11, 0.18) | 61 |
| 2022-03-02 | TowerBridge | SacTrawl | 172 | 0.985 (0.961, 0.994) | 0.126 (0.1, 0.16) | 54 |
| 2022-03-02 | NA | NA | 167 | NA (NA, NA) | 0.116 (0.09, 0.15) | 50 |
| 2022-03-02 | Freeport | Abv_Clarksburg | 152 | 0.991 (0.964, 0.998) | 0.107 (0.08, 0.14) | 46 |
| 2022-03-02 | Abv_Clarksburg | Hood | 148 | 0.995 (0.981, 0.999) | 0.102 (0.08, 0.14) | 44 |
| 2022-03-02 | Hood | Chipps | 138 | 0.993 (0.989, 0.996) | 0.098 (0.07, 0.13) | 42 |
| 2022-03-02 | Chipps | Benicia | 71 | 0.994 (0.981, 0.998) | 0.063 (0.04, 0.09) | 26 |
| 2022-03-02 | Benicia | GoldenGateE | 52 | 1 (1, 1) | 0.056 (0.04, 0.08) | 24 |
| 2022-03-02 | NA | NA | 2 | NA (NA, NA) | 0.056 (0.04, 0.08) | 11 |
5.2.3 Migration Timing
Cumulative Raw Catch: RBDD, Chipps, Tisdale, Knights, Sac Beach Seines, Sac Trawls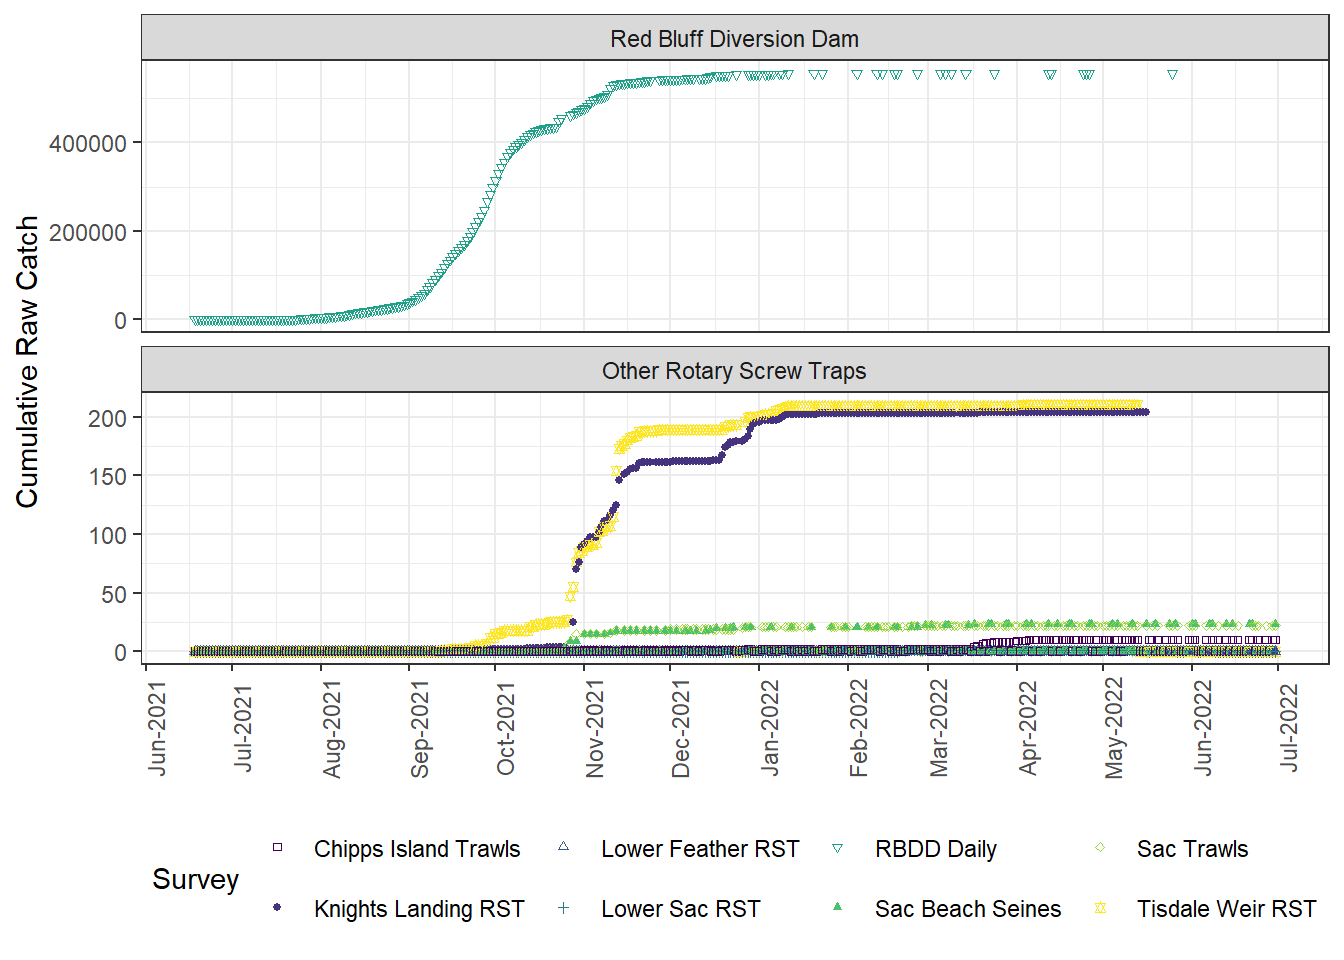
Figure 5.6: Raw Juvenile Rotary Screw Trap Cumulative Catch
Median Passage Dates
Migration Timing
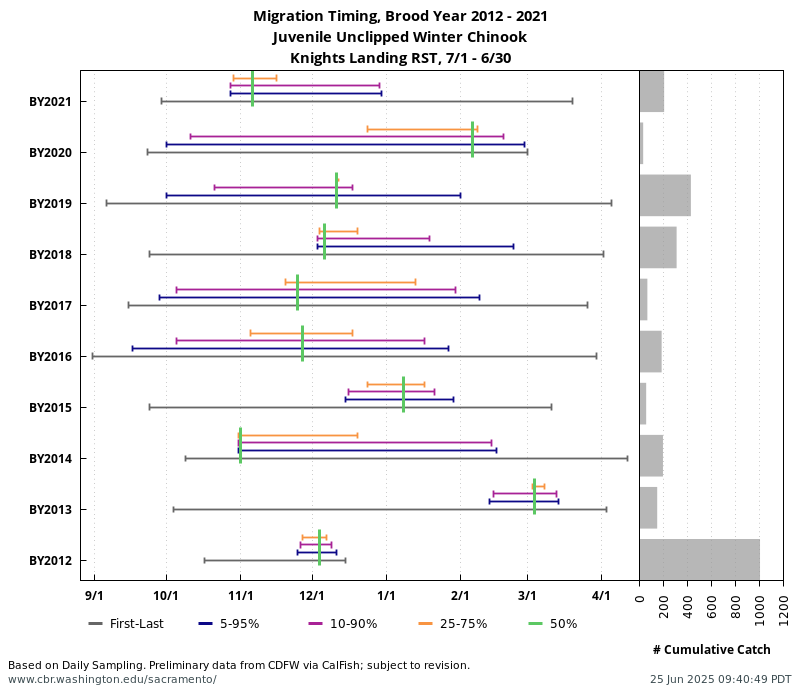
Figure 5.7: Knights Landing Rotary Screw Trap Migration Timing
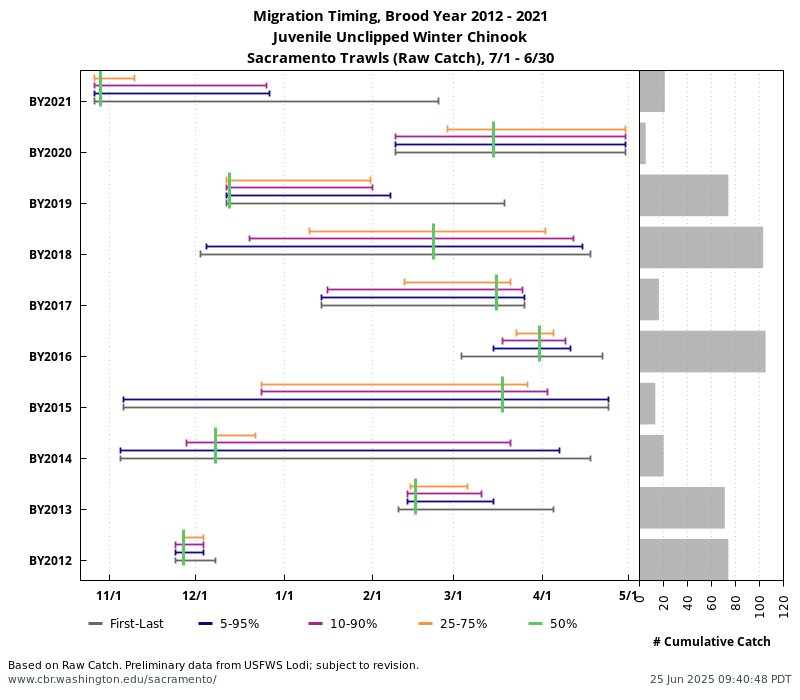
Figure 5.8: Sacramento Trawl Timing