Chapter 6 Sacramento-San Joaquin Delta Juveniles
This section describes environmental attributes associated with and responses during the out-migrating juvenile life stage in the Sacramento-San Joaquin Delta.

6.2 Environmental Drivers
6.2.1 Sacramento River Flow and Delta Outflow
| Year | Month | Station | Mean | Min | Max |
|---|---|---|---|---|---|
| 2021 | December | FPT | 8616.8 | -5360 | 36600 |
| 2022 | January | FPT | 12824.9 | 1370 | 32600 |
| 2022 | February | FPT | 8173.3 | 2880 | 17200 |
| 2022 | March | FPT | 6008.5 | -1390 | 17000 |
| 2022 | April | FPT | 4295.7 | -3630 | 15700 |
| 2022 | May | FPT | 3310.5 | -4040 | 15300 |
| 2022 | June | FPT | 4553.0 | -2710 | 18300 |
| 2021 | December | DTO | 18383.4 | 2674 | 45494 |
| 2022 | January | DTO | 13135.7 | 5266 | 33374 |
| 2022 | February | DTO | 11724.5 | 11150 | 12147 |
| 2022 | March | DTO | 9559.9 | 5712 | 12035 |
| 2022 | April | DTO | 7716.9 | 4865 | 11825 |
| 2022 | May | DTO | 4553.6 | 3082 | 5697 |
| 2022 | June | DTO | 4936.1 | 3937 | 6935 |
| 2021 | December | OMR | -2738.9 | -9193 | -86 |
| 2022 | January | OMR | -4493.8 | -5631 | -1289 |
| 2022 | February | OMR | -1688.3 | -4780 | -389 |
| 2022 | March | OMR | -1919.8 | -3776 | 191 |
| 2022 | April | OMR | -981.3 | -2710 | 2423 |
| 2022 | May | OMR | -1690.0 | -3774 | 2519 |
| 2022 | June | OMR | -1922.2 | -3400 | 2523 |
Figure 6.3: Freeport (FPT) Average Flows (cfs) in 2021 and over the 10-year average
Figure 6.4: Delta Outflow (DTO) in 2021 and over the 10-year average
Figure 6.5: OMR Flow (OMR) (cfs) in 2021 and over the 10-year average
Summary
Sacramento River at Freeport: Peak flows were 3.66^{4} cfs and occurred in December. The highest mean flows were 1.28249^{4} cfs and occurred in January. Flow was generally lower than average.
Delta Outflow: Peak Delta outflow was 4.5494^{4} cfs and occurred in December. The highest mean Delta outflow was 1.83834^{4} cfs and occurred in December. Flow was generally lower than average.
Old and Middle River: The most negative OMR flows were -9193 cfs and occurred in December. The most negative mean OMR flows were -4493.8 cfs and occurred in January. OMR was generally similar to average.
6.2.2 Water Temperature
| Year | Month | Station | Mean | Min | Max | Days > 57.2 Degf | Days > 63 Degf |
|---|---|---|---|---|---|---|---|
| 2021 | December | FPT | 49.6 | 45.9 | 55.4 | 0 | 0 |
| 2022 | January | FPT | 48.6 | 45.7 | 50.0 | 0 | 0 |
| 2022 | February | FPT | 51.6 | 47.5 | 55.0 | 0 | 0 |
| 2022 | March | FPT | 57.9 | 52.9 | 64.9 | 17 | 5 |
| 2022 | April | FPT | 62.7 | 58.8 | 67.6 | 30 | 16 |
| 2022 | May | FPT | 68.8 | 62.2 | 75.2 | 31 | 31 |
| 2022 | June | FPT | 73.3 | 69.6 | 77.9 | 29 | 29 |
| 2021 | December | SUS | 50.2 | 45.9 | 54.7 | 0 | 0 |
| 2022 | January | SUS | 48.8 | 45.7 | 50.5 | 0 | 0 |
| 2022 | February | SUS | 51.8 | 47.7 | 55.8 | 0 | 0 |
| 2022 | March | SUS | 58.2 | 51.8 | 64.9 | 18 | 7 |
| 2022 | April | SUS | 63.1 | 59.9 | 68.0 | 30 | 23 |
| 2022 | May | SUS | 69.2 | 63.7 | 75.2 | 31 | 31 |
| 2022 | June | SUS | 74.1 | 70.9 | 77.9 | 30 | 30 |
| 2021 | December | SWE | 50.1 | 45.9 | 54.5 | 0 | 0 |
| 2022 | January | SWE | 48.7 | 45.7 | 50.4 | 0 | 0 |
| 2022 | February | SWE | 51.7 | 47.8 | 54.5 | 0 | 0 |
| 2022 | March | SWE | 57.9 | 52.0 | 64.0 | 16 | 5 |
| 2022 | April | SWE | 62.8 | 59.9 | 66.7 | 30 | 17 |
| 2022 | May | SWE | 68.8 | 63.9 | 73.4 | 31 | 31 |
| 2022 | June | SWE | 73.6 | 70.7 | 76.8 | 30 | 30 |
| 2021 | December | GSS | 50.2 | 46.0 | 54.7 | 0 | 0 |
| 2022 | January | GSS | 48.9 | 45.9 | 55.4 | 0 | 0 |
| 2022 | February | GSS | 51.9 | 47.8 | 55.2 | 0 | 0 |
| 2022 | March | GSS | 58.0 | 52.0 | 64.2 | 17 | 6 |
| 2022 | April | GSS | 63.0 | 56.3 | 66.9 | 30 | 19 |
| 2022 | May | GSS | 69.0 | 64.0 | 75.9 | 31 | 31 |
| 2022 | June | GSS | 73.8 | 70.9 | 77.0 | 30 | 30 |
| 2021 | December | MAL | 52.4 | 47.6 | 57.8 | 3 | 0 |
| 2022 | January | MAL | 49.2 | 47.1 | 51.7 | 0 | 0 |
| 2022 | February | MAL | 51.9 | 49.6 | 54.9 | 0 | 0 |
| 2022 | March | MAL | 57.0 | 53.0 | 61.3 | 18 | 0 |
| 2022 | April | MAL | 61.5 | 59.0 | 64.1 | 30 | 7 |
| 2022 | May | MAL | 64.6 | 61.0 | 71.1 | 31 | 27 |
| 2022 | June | MAL | 70.1 | 66.3 | 75.1 | 30 | 30 |
Summary
Maximum water temperature was 77.9 °F and occurred in June. The highest mean water temperature was 73.3 °F and occurred in June.
Maximum water temperature was 77.9 °F and occurred in June. The highest mean water temperature was 74.1 °F and occurred in June.
Maximum water temperature was 77 °F and occurred in June. The highest mean water temperature was 73.8 °F and occurred in June.
Maximum water temperature was 75.1 °F and occurred in June. The highest mean water temperature was 70.1 °F and occurred in June.
Temperature Exceedances:
- 57.2°F: Upper range of optimal rearing temperature for juvenile Chinook Salmon (Windell et al. 2017)
- 63°F: Temperature at which smolt development is inhibited (Windell et al. 2017)
- Water temperature exceeded optimal rearing temperature consistently (14 days or more) starting in March for FPT, March for SUS, March for SWE, March for GSS, and March for MAL
- Water temperature reached temperature at which smolt development is inhibited consistently starting in `r March for FPT, March for SUS, March for SWE, March for GSS, and April for MAL
6.2.3 Dissolved Oxygen
| Year | Month | Station | Mean | Min | Max | Days < 6 Mg/L |
|---|---|---|---|---|---|---|
| 2021 | December | SRH | 10.1 | 9.5 | 10.7 | 0 |
| 2022 | January | SRH | 11.0 | 10.6 | 11.4 | 0 |
| 2022 | February | SRH | 10.9 | 10.2 | 11.7 | 0 |
| 2022 | March | SRH | 9.9 | 8.5 | 11.1 | 0 |
| 2022 | April | SRH | 9.0 | 8.3 | 9.6 | 0 |
| 2022 | May | SRH | 8.5 | 7.9 | 10.5 | 0 |
| 2022 | June | SRH | 8.1 | 7.5 | 9.1 | 0 |
| 2021 | December | SXS | 9.7 | 9.2 | 10.4 | 0 |
| 2022 | January | SXS | 10.7 | 10.2 | 11.2 | 0 |
| 2022 | February | SXS | 10.9 | 9.7 | 12.5 | 0 |
| 2022 | March | SXS | 10.3 | 8.5 | 12.5 | 0 |
| 2022 | April | SXS | 9.4 | 8.6 | 10.7 | 0 |
| 2022 | May | SXS | 8.9 | 7.5 | 11.9 | 0 |
| 2022 | June | SXS | 8.1 | 7.1 | 9.2 | 0 |
| 2021 | December | BLP | 9.5 | 8.3 | 10.4 | 0 |
| 2022 | January | BLP | 9.8 | 9.3 | 10.5 | 0 |
| 2022 | February | BLP | 10.6 | 9.8 | 10.9 | 0 |
| 2022 | March | BLP | 10.3 | 9.2 | 11.2 | 0 |
| 2022 | April | BLP | 9.4 | 8.6 | 10.4 | 0 |
| 2022 | May | BLP | 9.0 | 8.0 | 10.1 | 0 |
| 2022 | June | BLP | 8.4 | 7.7 | 9.9 | 0 |
| 2021 | December | MAL | 9.4 | 8.2 | 10.4 | 0 |
| 2022 | January | MAL | 10.1 | 9.6 | 10.6 | 0 |
| 2022 | February | MAL | 10.3 | 9.8 | 10.6 | 0 |
| 2022 | March | MAL | 10.1 | 9.3 | 10.9 | 0 |
| 2022 | April | MAL | 9.3 | 8.8 | 10.0 | 0 |
| 2022 | May | MAL | 8.9 | 8.3 | 9.4 | 0 |
| 2022 | June | MAL | 8.4 | 7.7 | 9.1 | 0 |
Summary
- Minimum dissolved oxygen was 7.5 mg/L and occurred in June. The lowest mean dissolved oxygen was 8.1 mg/L and occurred in June. DO did not reach values below 6mg/L.
- Minimum dissolved oxygen was 7.1 mg/L and occurred in June and NA. The lowest mean dissolved oxygen was 8.1 mg/L and occurred in June. DO did not reach values below 6mg/L.
- Minimum dissolved oxygen was 7.7 mg/L and occurred in June. The lowest mean dissolved oxygen was 8.4 mg/L and occurred in June. DO did not reach values below 6mg/L.
- Minimum dissolved oxygen was 7.7 mg/L and occurred in June. The lowest mean dissolved oxygen was 8.4 mg/L and occurred in June. DO did not reach values below 6mg/L.
6.3 Biological Response
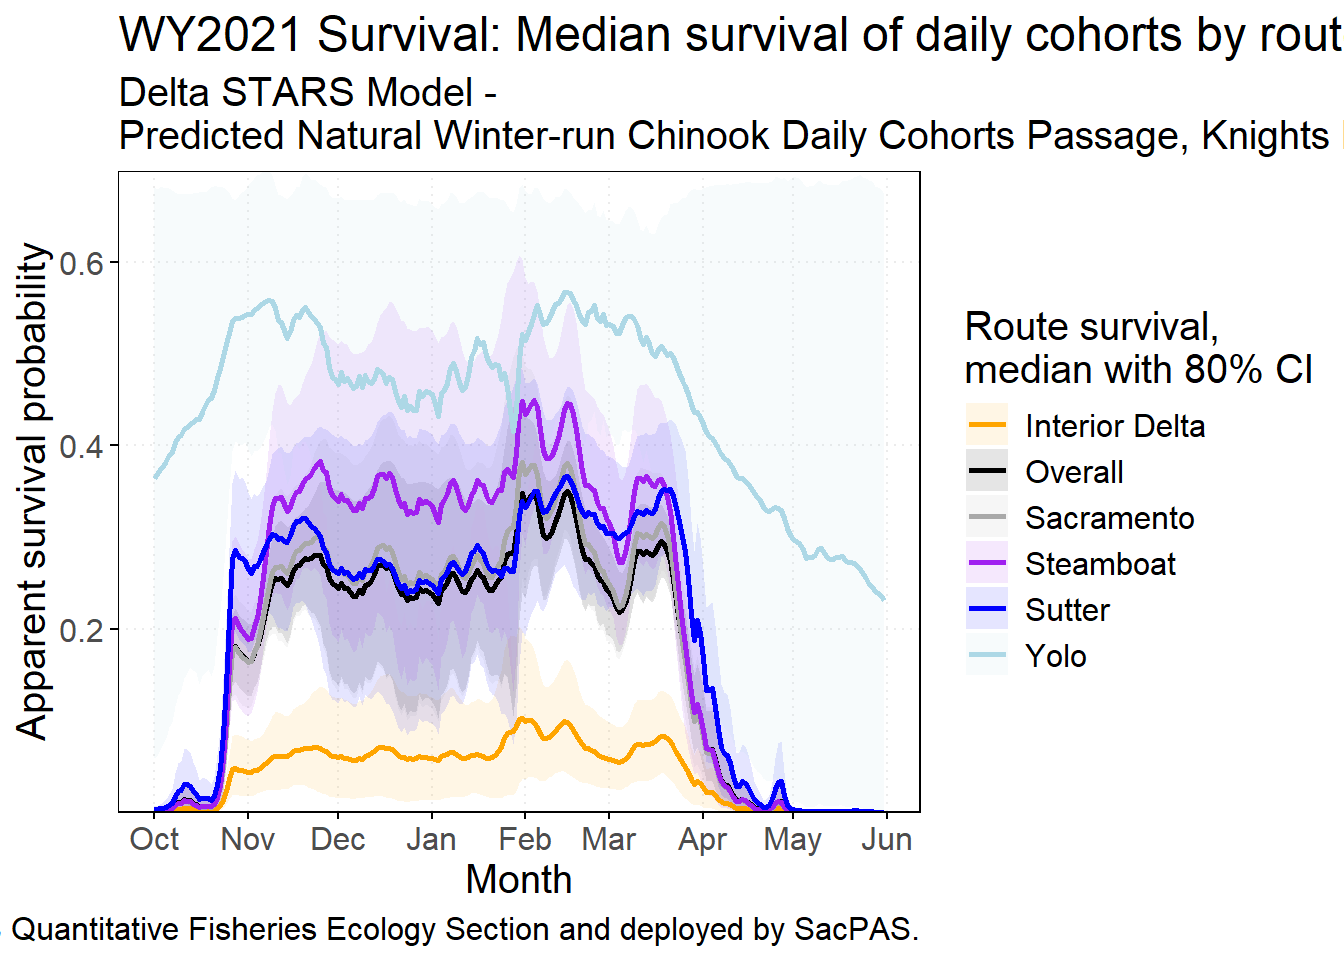
6.3.1 Survival
6.3.1.1 Hatchery Releases
Hatchery WRCS are released each year from Caldwell Park. Releases for BY 2021 occurred in February and March. - Cumulative survival from release to Benicia Bridge (6.4) - Release 1: Reach survival estimates ranged from 0.989 to 1 - Release 2: Reach survival estimates ranged from 0.985 to 1
| rel_date | reach_start | reach_end | rkm_start | ReachSurvival | CumulativeSurvival | count |
|---|---|---|---|---|---|---|
| 2022-02-10 | Abv_FremontWeir | SacFeather | 215 | 0.995 (0.965, 0.999) | 0.174 (0.12, 0.25) | 21 |
| 2022-02-10 | SacFeather | Blw_Elkhorn_GS1 | 206 | 1 (1, 1) | 0.165 (0.11, 0.24) | 22 |
| 2022-02-10 | Blw_Elkhorn_GS1 | TowerBridge | 192 | 0.998 (0.984, 1) | 0.165 (0.11, 0.24) | 23 |
| 2022-02-10 | TowerBridge | SacTrawl | 172 | 1 (1, 1) | 0.158 (0.11, 0.23) | 22 |
| 2022-02-10 | Freeport | Abv_Clarksburg | 152 | 1 (1, 1) | 0.137 (0.09, 0.2) | 19 |
| 2022-02-10 | Abv_Clarksburg | Hood | 148 | 1 (1, 1) | 0.137 (0.09, 0.2) | 19 |
| 2022-02-10 | Hood | Chipps | 138 | 0.992 (0.984, 0.996) | 0.137 (0.09, 0.2) | 19 |
| 2022-02-10 | Chipps | Benicia | 71 | 0.989 (0.959, 0.997) | 0.08 (0.04, 0.14) | 11 |
| 2022-02-10 | Benicia | GoldenGateE | 52 | 1 (1, 1) | 0.065 (0.03, 0.12) | 9 |
| 2022-03-02 | Abv_FremontWeir | SacFeather | 215 | 0.998 (0.985, 1) | 0.151 (0.12, 0.19) | 58 |
| 2022-03-02 | SacFeather | Blw_Elkhorn_GS1 | 206 | 0.996 (0.989, 0.999) | 0.149 (0.12, 0.19) | 61 |
| 2022-03-02 | Blw_Elkhorn_GS1 | TowerBridge | 192 | 0.994 (0.987, 0.997) | 0.142 (0.11, 0.18) | 61 |
| 2022-03-02 | TowerBridge | SacTrawl | 172 | 0.985 (0.961, 0.994) | 0.126 (0.1, 0.16) | 54 |
| 2022-03-02 | Freeport | Abv_Clarksburg | 152 | 0.991 (0.964, 0.998) | 0.107 (0.08, 0.14) | 46 |
| 2022-03-02 | Abv_Clarksburg | Hood | 148 | 0.995 (0.981, 0.999) | 0.102 (0.08, 0.14) | 44 |
| 2022-03-02 | Hood | Chipps | 138 | 0.993 (0.989, 0.996) | 0.098 (0.07, 0.13) | 42 |
| 2022-03-02 | Chipps | Benicia | 71 | 0.994 (0.981, 0.998) | 0.063 (0.04, 0.09) | 26 |
| 2022-03-02 | Benicia | GoldenGateE | 52 | 1 (1, 1) | 0.056 (0.04, 0.08) | 24 |
Figure 6.6: Cumulative Survival by River Kilometer
6.3.2 Abundance
Catch for all surveys
Summary
- Juvenile WRCS cumulative total catch:
- Sacramento Trawls at Sherwood Harbor: 22 (Index = 22)
- Sacramento Beach Seines: 23 (Index = 50.2)
- Chipps Island Trawl: 10
- Migration Timing:
- Delta Entry (Sacramento Trawls at Sherwood Harbor):
- First: October 27, 2021
- Median: June 18, 2021
- Last: February 23, 2022
- First: October 27, 2021
- Delta Exit (Chipps Island Trawl):
- First: November 01, 2021
- Median: June 18, 2021
- Last: April 05, 2022
- First: November 01, 2021
- Delta Entry (Sacramento Trawls at Sherwood Harbor):
6.3.3 Migration Timing
Sac Trawl Data (Raw Catch by Day or Week?)
SacPAS Migration Timing Table - LAD Median Dates, 10 Year Comparison Sacramento Beach Seines, Trawls, Chipps Island Trawls
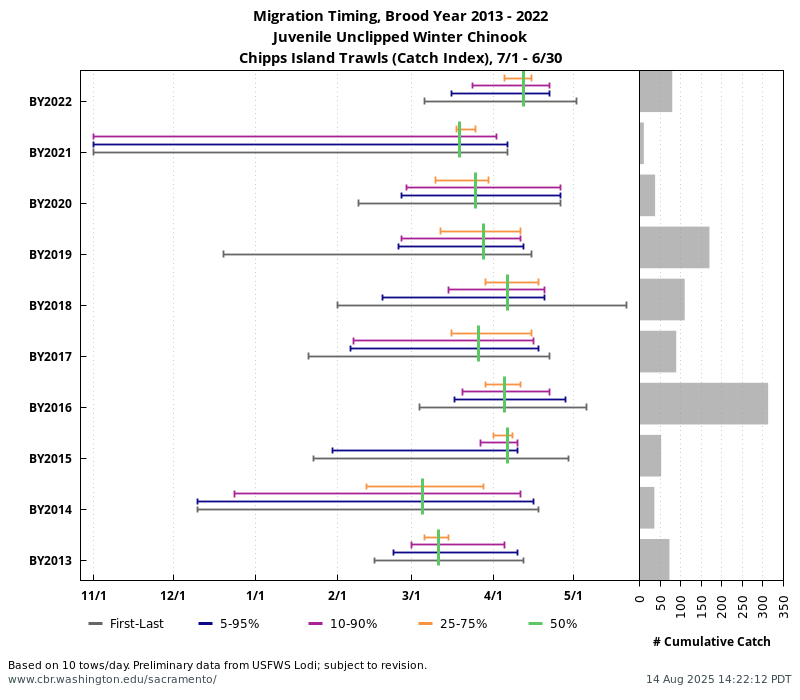
Figure 6.7: Combined Beach Seines Migration Timing
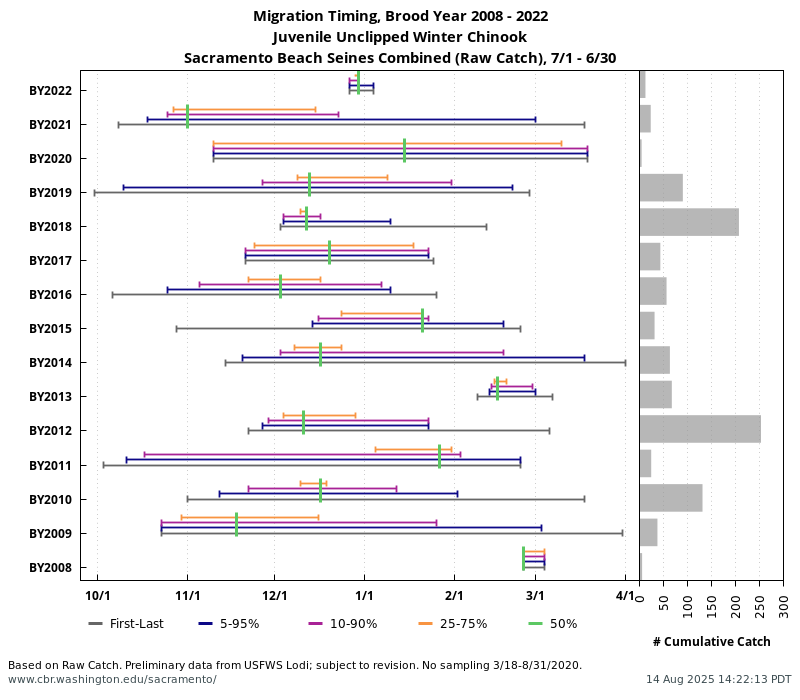
Figure 6.8: Delta Exit (Chipps Island) Migration Timing
6.3.4 Condition
Plot of current year sizes for Salvage, Chipps, Sacramento Beach Seines, Sac Trawls at Sherwood
(#fig:salvage_fl-fig)Fork Lengths of Genetic and LAD Winter Run Chinook Salmon Juveniles at Salvage. Points indicate median fork length.
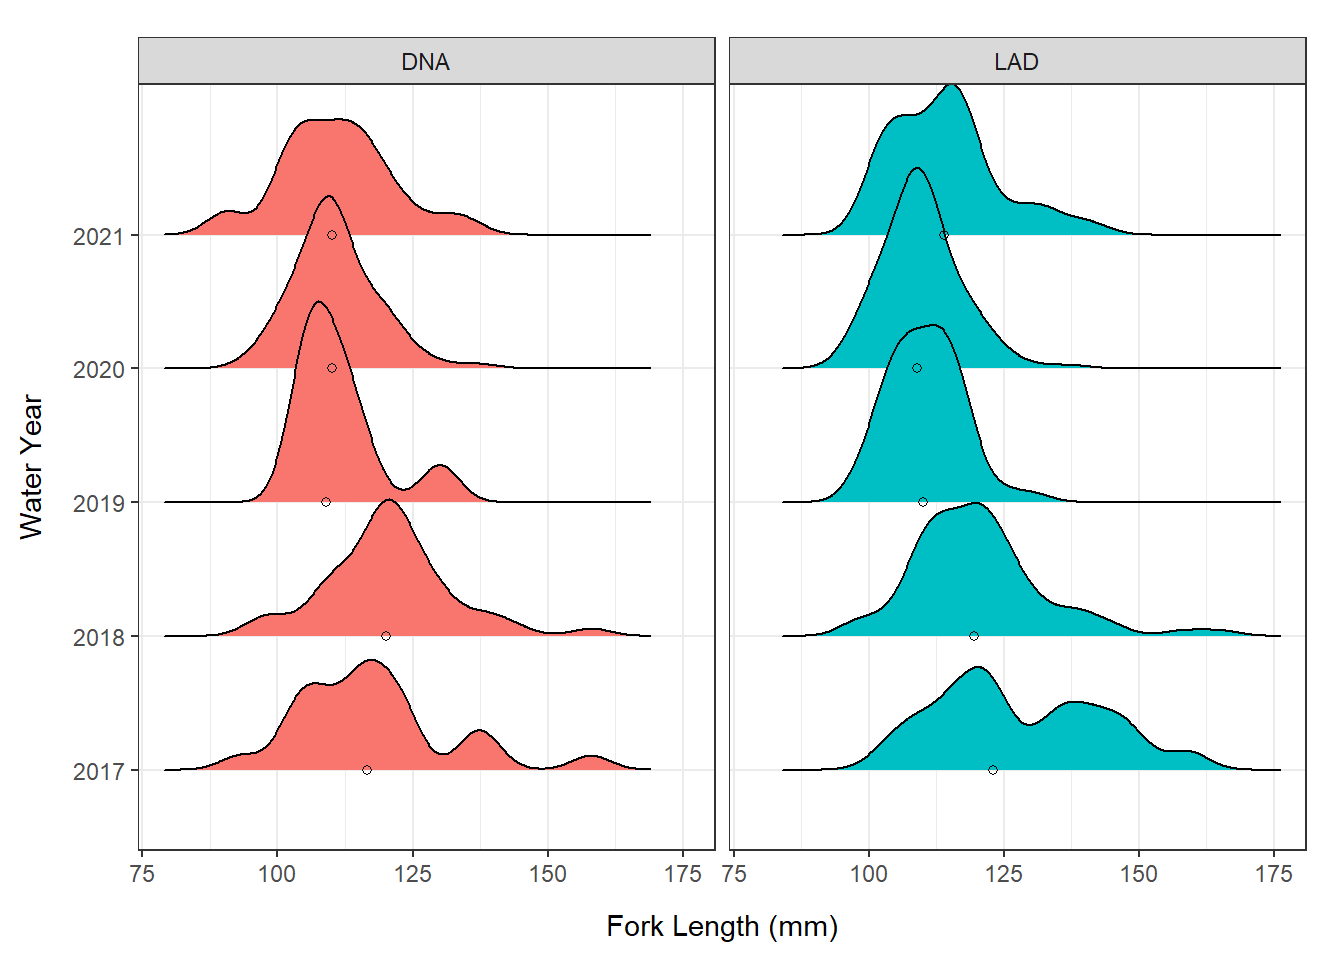
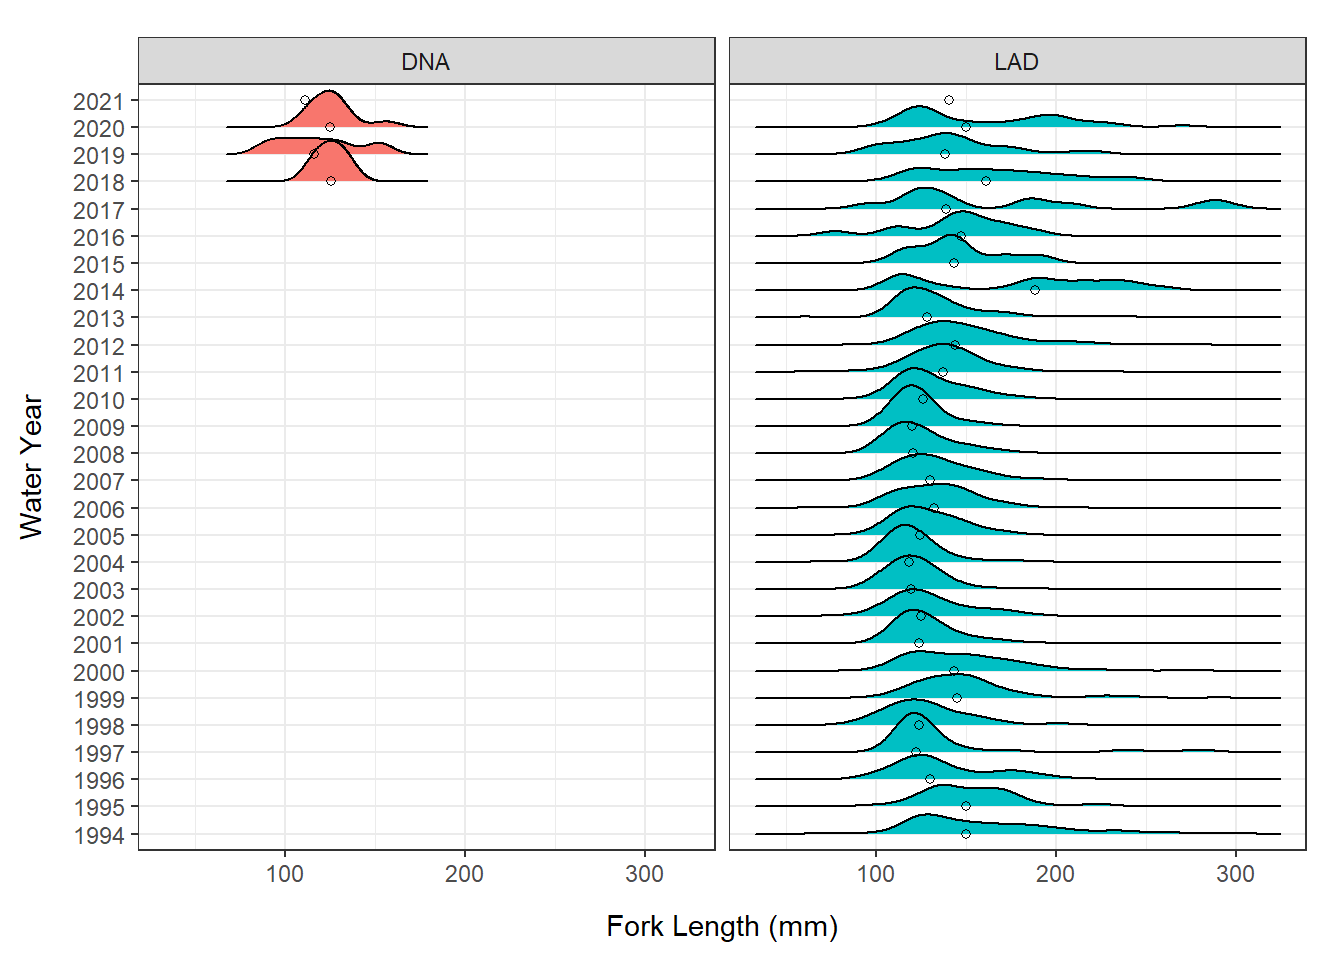
(#fig:chipps_fl-fig)Fork Lengths of Genetic and LAD Winter Run Chinook Salmon Juveniles at Chipps Trawl. Points indicate median fork length.
6.3.5 Entrainment
- Describe take levels based off JPE letter
- Describe trigger levels
- Describe loss
Salvage Timing
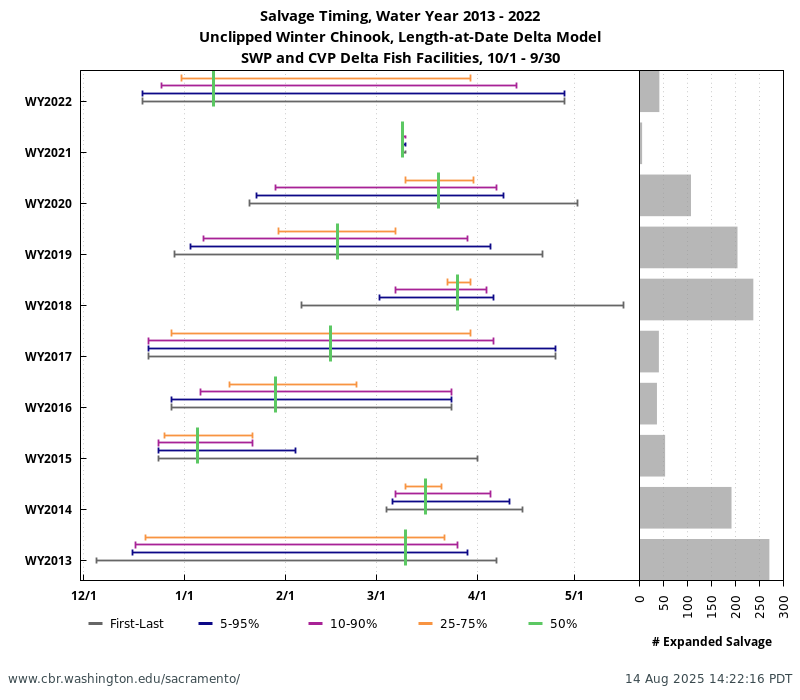
Figure 6.9: Salvage Timing
Winter-run Current and Historic Cumulative Salvage (Line plots)
6.3.5.1 Historical Loss
Summary
Total LAD loss for BY 2021 was 73.04, which was 0.0005841424% of the JPE. Loss was lower than the 10-year average of 284.16 (Figure 6.10.
Total Genetic loss for BY 2021 was 0, which was 0% of the JPE. Loss was lower than the 10-year average of 92.65 (Figure 6.11.
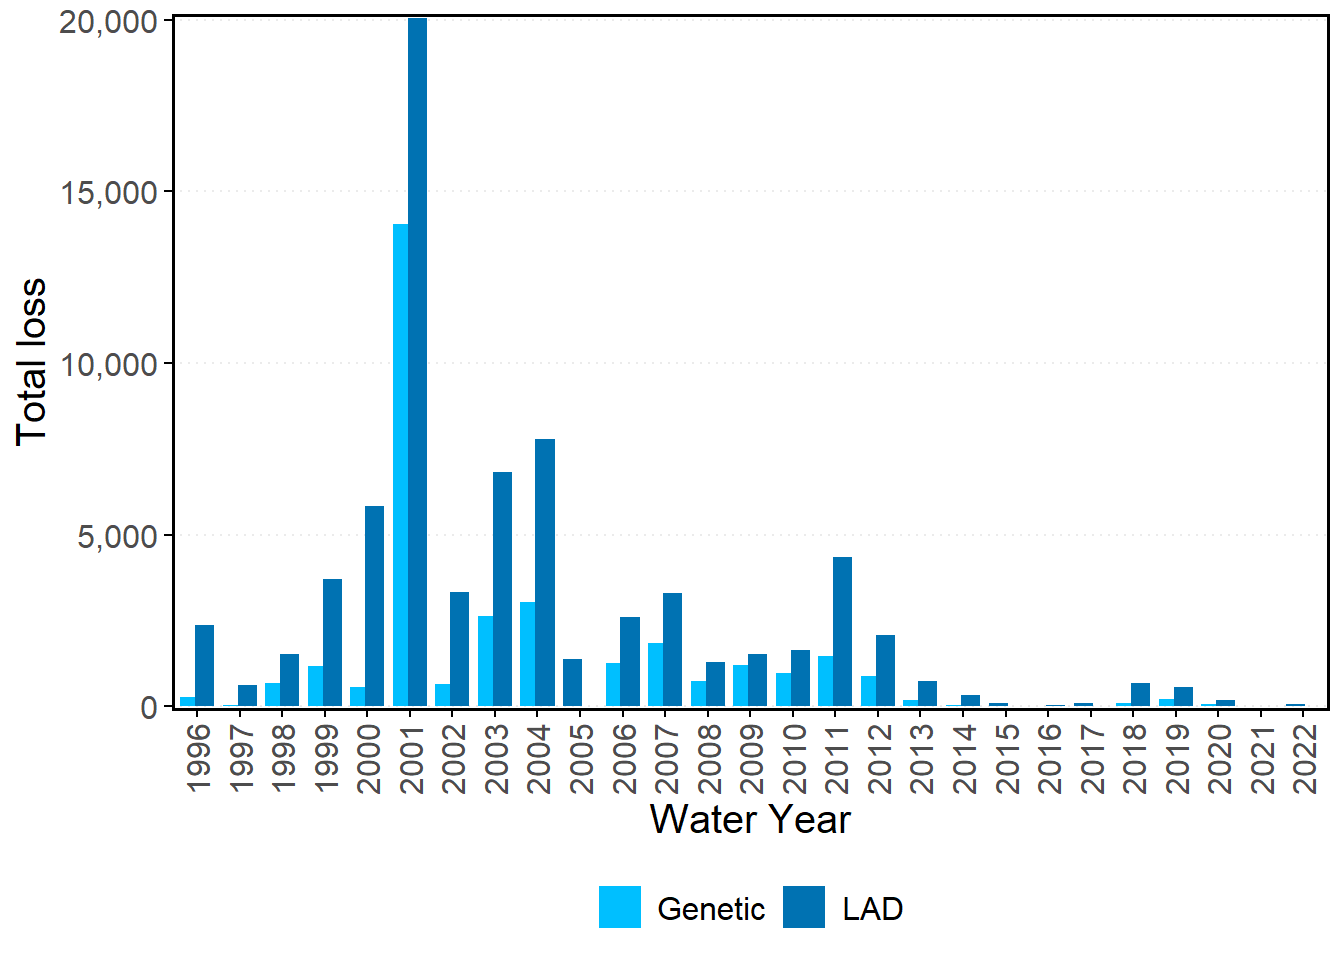
Figure 6.10: Genetic vs Length-At-Date (LAD) Winter Run Chinook Salmon Loss through 2021. Genetic loss data provided by USBR before WY 2020. LAD and genetic loss after 2020 sourced from CDFW Salvage Database.
6.3.5.2 Loss as a Percent of JPE
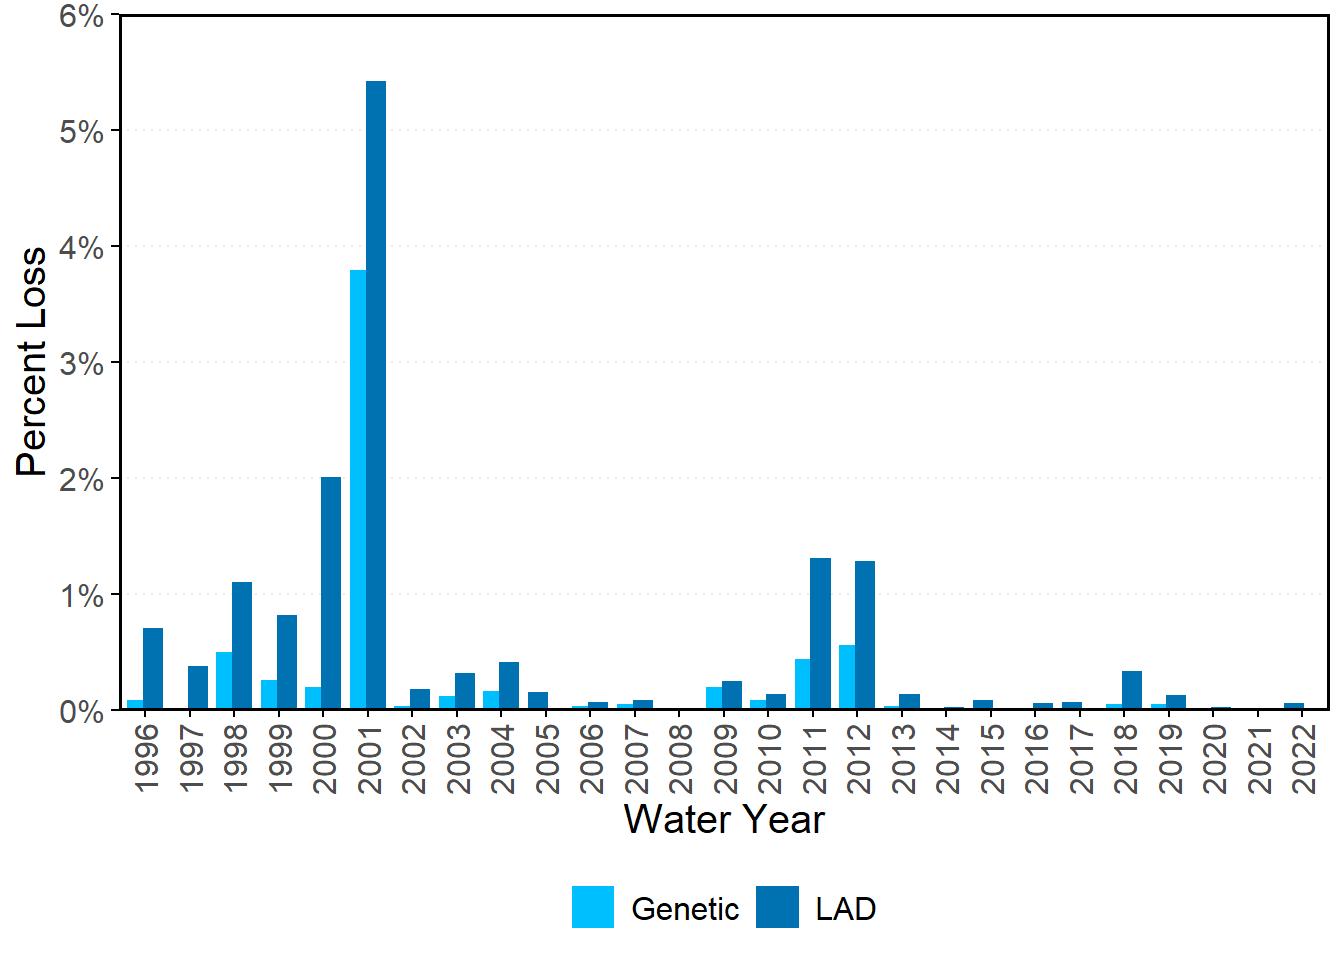
Figure 6.11: Genetic vs Length-At-Date (LAD) Winter Run Chinook Salmon Percent Loss of JPE through 2021. Genetic loss data provided by USBR before WY 2020. LAD and genetic loss after 2020 sourced from CDFW Salvage Database.
Monitoring Sources for abundance, growth/size, migration timing/duration
Sac Trawl
Tisdale Weir
Knights Landing
GCID
DJFMP
Yolo Bypass
Chipps Island Trawl (Exit)
Genetic (Chipps, SWP/CVP, Knights Landing, Yolo Bypass)
Hatchery real-time: Calfish Track/ERDDAP
Natural Origin Smolt survival (O Farell et al. 2018)
Hatchery Origin Smolt survival
Modeled: ** Juvenile: STARS ** Fish Model
Survival to Delta: Production (Hatchery JPE, Modeled JPE)